Microwave spectra represent the electromagnetic radiation absorbed or emitted by molecules when they undergo transitions between discrete rotational energy levels. These spectra are a key component in the study of molecular structure and dynamics. They provide valuable insights about molecular properties, such as bond lengths and moments of inertia.
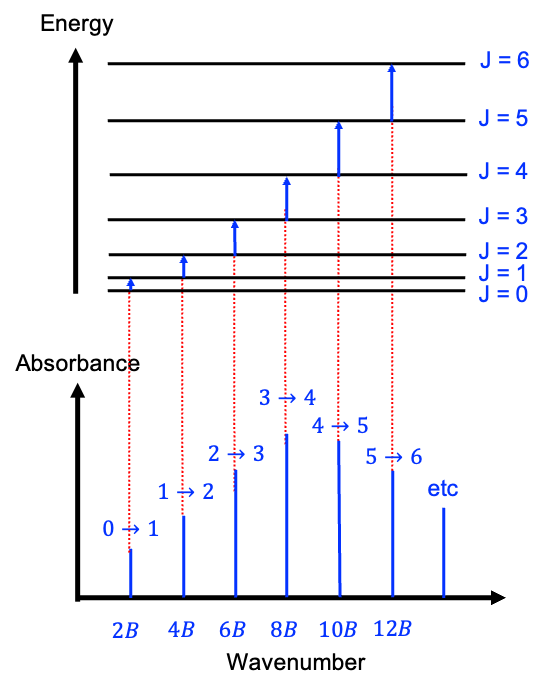
An ideal, pure absorption rotational spectrum of a rigid linear molecule, generated in the microwave frequency range of 3 to 600 GHz (1 to 200 cm-1), typically exhibits a series of absorption lines that correspond to the rotational transitions between discrete rotational energy levels (see diagram below). In the absence of an external magnetic field, these transitions follow the selection rule , meaning that a molecule can only transition from one rotational level to the next higher level.


Question
What is the difference between an absorption spectrum and an emission spectrum?
Answer
An external radiation is required to produce an absorption spectrum. The detector measures the amount of energy absorbed by the sample at each frequency, corresponding to transitions with .
In an emission spectrum, the sample itself acts as the source. It must first be excited to higher-energy rotational states, for example by heating or applying an electrical discharge. The detector then measures the amount of energy emitted by the sample, corresponding to transitions with .
Both types of spectra can be obtained using the same spectrometer, with different settings. Suppose the spectrometer is configured to record the absorption spectrum of a sample. If two rotational states are populated under the experimental conditions, the sample can both absorb and emit radiation at the same frequency, since both processes involve transitions with between the same pair of quantised energy levels. However, the conditions for measuring an absorption spectrum are typically set to ensure that net absorption occurs.
The rotational energy levels are given by eq44 or eq45 and the frequencies of the transitions are directly related to the rotational constant , and as such, the spacing between the spectral lines provides information about the moment of inertia and the molecular structure. Using the definition
, we have
Therefore, the first peak, obtained by substituting into eq80, lies at the point
along the horizontal axis. Similarly, the second and third peaks are at
and
respectively. In other words, the peaks in an ideal rotational spectrum (without centrifugal distortion) of a rigid linear rotor are equally spaced at
.

Question
Calculate the moment of inertia and bond length of HCl if the line spacing in the rotational spectrum is 21.2 cm-1?
Answer
Since the spacing is , we have
cm-1. Using the formula
gives
kg m2. Furthermore,
. Therefore, the bond length is
m.
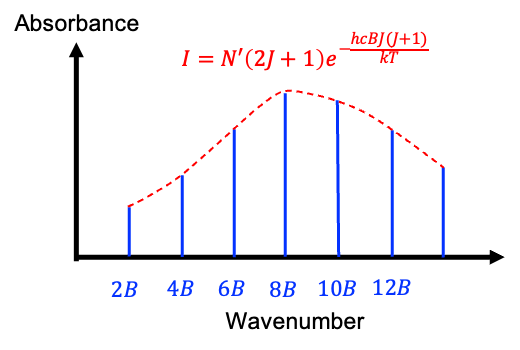
The intensity of each transition depends on the population of the initial level
, which is governed by the Boltzmann distribution, with higher-
states being less populated at lower temperatures:
where
is the Boltzmann constant.
is the number of particles in the energy state
.
is the total number of particles in the system.
Since represents the fraction of particles in the state
, the intensity of a spectral line is proportional to
, where the value
corresponds to a specific energy level. However, there are
degenerate states associated with each value of
in a rigid linear molecule. This degeneracy increases the statistical weight of higher
levels, redistributing the population towards more degenerate states, which become thermally accessible at typical laboratory temperatures. In other words, at a given temperature, more particles will occupy a higher
state with greater degeneracy at equilibrium than they would if the state were non-degenerate. Therefore, when a sample is exposed to an external microwave field, the intensity
of each allowed transition in the pure rotational spectrum is proportional to the population of the initial state, which is the product of
and
. This gives:
where is a proportionality constant and
is given by eq45.

The factor in eq81 increases linearly with
, while the exponential term decreases exponentially. As a result, the graph of
versus
forms a skewed bell curve (see diagram above), with a maximum found by treating
as a continuous variable and taking the derivative of
with respect to
:
Setting , and noting that
for any finite
, gives
Since must be an integer, the maximum intensity occurs at the value of
closest to the result of eq82.

Question
Is the intensity of each transition dependent on the electric dipole moment?
Answer
Although the transition probability between adjacent rotational states is proportional to , which depends on the magnitude of the electric dipole moment, the sample molecules in the waveguide of a typical microwave spectrometer are randomly oriented. As a result, the effect transition dipole moment does not vary significantly from one
transition to the next for a given molecule. Therefore, while the absolute intensity depends on the dipole moment, it is often treated as a constant factor when comparing transitions within the same molecule.
For a symmetric rotor, and
is also given by eq80. However, the spectrum is not just a single series of equally spaced lines like that of a linear rotor. Instead, each value of
is associated with a series of lines with equal spacing of
. In other words, a symmetric top spectrum consists of multiple superimposed series of equally spaced lines, each corresponding to a different value of
. As a result, the individual lines may not be as clearly resolved and may appear as a denser pattern compared to that of a linear molecule. Nevertheless, the overall intensity envelope of the spectrum still resembles a skewed bell curve, with the maximum intensity occurring at the
value where the population is highest.
In practice, the peaks in a real rotational spectrum are not vertical lines but have finite width and shape, appearing as broadened curves. This broadening arises, under typical laboratory conditions, from several effects:
-
- Doppler broadening, due to the thermal motion of molecules, causes a spread in observed frequencies as molecules move towards or away from the detector.
- Instrumental broadening results from the finite resolution of the spectrometer itself.
Beyond broadening, other phenomena affect the detailed structure and spacing of the spectral lines:
-
- Centrifugal distortion causes deviations from the ideal rigid rotor model. As rotational speed increases with higher
levels, the molecular bond stretches slightly, increasing the moment of inertia and decreasing the rotational constant
. This leads to uneven spacing between lines, especially at higher
, and is accounted for using a correction term.
- Centrifugal distortion causes deviations from the ideal rigid rotor model. As rotational speed increases with higher
-
- Isotopic substitution alters the moment of inertia due to the change in atomic mass, thereby changing the rotational constant
. Different isotopologues of the same molecule produce distinct sets of rotational lines, each with slightly different spacings. If multiple isotopes are present in the sample, the resulting spectrum may show clusters or duplications of lines, corresponding to each isotopologue.
- Isotopic substitution alters the moment of inertia due to the change in atomic mass, thereby changing the rotational constant
Together, these effects lead to a rotational spectrum that is richer and more complex than the idealised, evenly spaced series of lines predicted by the rigid rotor model.

Question
Do large molecules, such as polymers, enzymes and DNA, undergo rotational transitions when radiated by microwaves?
Answer
Yes, large molecules can undergo rotational transitions when exposed to microwave radiation. However, such molecules are flexible and do not behave like rigid rotors, which invalidates some of the assumptions used in microwave rotational spectroscopy. If we assume that still applies, the rotational energy levels will be very closely spaced because the moment of inertia
is large, and
becomes very small. As a result, individual rotational transitions for large molecules often overlap, leading to broad, unresolved bands or a complete loss of identifiable peaks.
Furthermore, instead of undergoing uniform rotation, different parts of these complex molecules can move independently in response to the microwave field, including side-chain rotations and wobbling. These movements cause the molecules to collide with neighbouring molecules, converting the absorbed microwave energy into kinetic energy and heat. This general heating effect may denature the large molecules, leading to further changes in their structure and, consequently, variations in the observed spectra.