Collision theory

Reactions occur when particles collide with sufficient energy to overcome the potential energy of repulsion between the electron densities of the approaching particles, and often, to break and rearrange bonds in the particles.

Therefore, not all collisions successfully result in a reaction. For a reaction to take place, particles must collide with the correct orientation and a minimum amount of energy called the activation energy, Ea, which differs between reactions.

Consider the collision of dinitrogen tetraoxide molecules to form nitrogen dioxide.

N_2O_4(g)\rightleftharpoons 2NO_2(g)

A sample of at a particular temperature consists of molecules with various energies. This is because after colliding with one another, some molecules gain energy while others lose energy, with the bulk of the molecules having intermediate energies. A fraction, however, have sufficient energy, ≥ Ea, to collide with each other in the correct orientation and dissociate into nitrogen dioxide molecules. Such collisions are called effective collisions.

The different energies of the molecules can be described by the graph above. The graph, called the Maxwell-Boltzmann distribution, was first derived by James Maxwell, a Scottish scientist in 1860 and later improved upon by Ludwig Boltzmann, an Austrian physicist. The various areas under the curve represent the fraction of molecules with certain energies, with the green area expressing the proportion of molecules with sufficient energies to react.

In general, factors that increase the rate of effective collisions between particles, or provide alternate reaction pathways with lower activation energies, will increase the rate of the reaction. These factors are:

    1. the concentration of the reactants (or pressure, if the reactants are gases)
    2. the surface area of the reacting particles
    3. the temperature at which the reaction is occurring, and
    4. the presence of a catalyst.


Next article: Effect of concentration (or pressure) on the rate of a reaction
Previous article: Measuring the rate of a reaction
Content page of basic chemical kinetics
Content page of Basic chemistry
Main content page

Effect of concentration (or pressure) on the rate of a reaction

Consider the reaction between an acid and a strip of magnesium:

2H_3O^+(aq)+Mg(s)\rightarrow Mg^{2+}(aq)+H_2(g)+2H_2O(l)

When we increase the concentration of the acid, we increase the number of hydroxonium ions per unit volume. This leads to a higher frequency of collisions between the hydroxonium ions and the magnesium strip and hence a higher probability of collisions with the correct orientation and with energies that are equal or greater than the activation energy for the reaction to occur. Similarly, for the reaction N_2O_4(g)\rightleftharpoons 2NO_2(g), an amount of N2O4 that exerts a higher pressure on the walls of a piston chamber implies that more N2O4 molecules within the bulk are colliding with one another effectively per unit time. A higher pressure can be obtained by injecting more N2O4 into the chamber or decreasing the volume of the chamber. Therefore, an increase in the concentration (or pressure) of reactants increases the rate of a reaction.

Question

The volume of CO2 produced from the reaction of excess CaCO3 with different 3 samples of HCl is shown in the graph above. Which of the curves is for:

    1. 40 cm3 of 0.01 M of HCl?
    2. 20 cm3 of 0.02 M of HCl?
    3. 20 cm3 of 0.01 M of HCl?
Answer
    1. B
    2. A
    3. C

Curve A corresponds to a sample of HCl that is most concentrated as it has the highest initial rate of reaction, i.e. steepest tangent of the graph at t = 0, and is therefore associated with sample 2. The samples of acid for Curves A and B consist of the same number of moles of HCl because both curves produce the same amount of CO2. So, if curve A is generated by sample 2, curve B must correspond to sample 1. Furthermore, curve B has a lower initial rate of reaction than curve A, as it has half the concentration of HCl.

Since CaCO3 is in excess, HCl is the limiting reactant, which means that curve C must be produced by a sample of acid that has half the number of moles of HCl as compared to curves A and B. Sample 3 fits this description. Moreover, as samples 1 and 3 have the same concentration of HCl, their reaction with CaCO3 should approximately proceed with the same initial rate of reaction, which is validated by the gradients of curves B and C at the origin.

Lastly, because sample 1 has the largest volume of acid versus the other two samples, it is expected to take the longest time to completely react with CaCO3 and this is confirmed by the time curve B takes to level off.


Next article: Effect of surface area of particles on the rate of a reaction
Previous article: Collision theory
Content page of basic chemical kinetics
Content page of Basic chemistry
Main content page

Effect of surface area of particles on the rate of a reaction

For a reaction where one of the reactants is a solid, e.g.

2H_3O^+(aq)+CaCO_3(s)\rightarrow Ca^{2+}(aq)+CO_2(g)+3H_2O(l)

an increase in surface area of the solid increases the rate of the reaction. This is because the collision of hydroxonium ions with the carbonate is limited by the surface area of the latter.

As illustrated by the diagram above, a big cube of CaCO3 has six surfaces with a total area of 24 cm3 available for the hydroxonium ions to collide. However, if the cube is broken down into smaller cubes, the total surface area accessible by the hydroxonium ions is now 48 cm3. This leads to a higher frequency of effective collision and therefore, a higher rate of reaction.

Question

The mass of a reacting mixture consisting of excess HCl and 2 samples of CaCO3 is monitored over time (see graph above).

Which of the curves is for:

i) 50 g of CaCO3 chips; ii) 50 g of finely grounded CaCO3?

When the reaction is repeated with 50 g of CaCO3 chips and H2SO4, the reaction stops with the bulk of the CaCO3 unreacted. Why?

Answer

Curve II corresponds to the finely grounded CaCO3 with a greater total surface area for reaction and hence a higher rate of reaction. The higher rate of reaction is deduced from the steeper gradient of curve II at (albeit a negative one) versus that of curve I.

The reaction stops prematurely when H2SO4 is used, due to the formation of insoluble CaSO4, which coats the surfaces of the unreacted chips, preventing further reaction.


Next article: Effect of temperature on the rate of a reaction
Previous article: Effect of concentration (or pressure) on the rate of a reaction
Content page of basic chemical kinetics
Content page of Basic chemistry
Main content page

Effect of temperature on the rate of a reaction

As mentioned in the section on collision theory, the energies of a gaseous reactant are distributed over a range that can be described by the Maxwell-Boltzmann distribution. These energies are mainly kinetic energies, which means that the gas particles are moving with different velocities. When we increase the temperature of a reaction mixture, we increase the average kinetic energy of the particles and hence their average velocities. This results in a higher rate of effective collisions between the reactants and therefore a higher rate of reaction.

The energy profiles of a reactant at various temperatures are shown on the Maxwell-Boltzmann distribution diagram above. At higher temperatures, the energy distribution curve shifts to the right with more reactant molecules reaching and exceeding the activation energyEa, of the reaction. Since the total number of molecules for the two curves must be the same (i.e. the area under the curve at T1 must be equal to that at T2), the curve at the higher temperature, with respect to the one at the lower temperature, is expected to flatten as the number of molecules with higher energies increases.

The effect of temperature on the rate of reactions can be observed in everyday life, for example, the spoiling of a bottle of milk that is left in the summer sun and the preservation of animal corpses that are buried deep in snow.


Next article: Effect of a catalyst on the rate of a reaction
Previous article: Effect of surface area of particles on the rate of a reaction
Content page of basic chemical kinetics
Content page of Basic chemistry
Main content page

Effect of a catalyst on the rate of a reaction

A catalyst is a substance that increases the rate of a reaction without itself being chemically changed at the end of the reaction. Catalysts can be categorised into two groups, namely, homogeneous or heterogeneous.

A homogeneous catalyst is one that is in the same phase as the reactants, while a heterogeneous catalyst is one that is in a different phase as the reactants. Consider the decomposition of aqueous hydrogen peroxide to oxygen:

2H_2O_2(aq)\rightarrow O_2(g)+2H_2O(l)\; \; \; \; \; \; \; \; 2

The reaction occurs very slowly under normal conditions due to its high activation energy. If a homogeneous catalyst, e.g. hydrobromic acid, is added, the reaction proceeds rapidly with the following two-step mechanism:

H_2O_2(aq)+2Br^-(aq)+2H^+\rightarrow Br_2(aq)+2H_2O(l)

H_2O_2(aq)+Br_2(aq)\rightarrow O_2(g)+2Br^-(aq)+2H^+(aq)

In the first step, a molecule of H2O2, in the presence of H+, oxidises two bromide ions to a molecule of aqueous bromine, while it is reduced to water. In the second step, another molecule of H2O2 reduces the aqueous bromine back into bromide ions and H+, with itself being oxidised to a molecule of oxygen. If we add the two equations, we get eq2. You’ll realise that hydrogen and bromide ions participate in the reaction but are not consumed at the end of it.

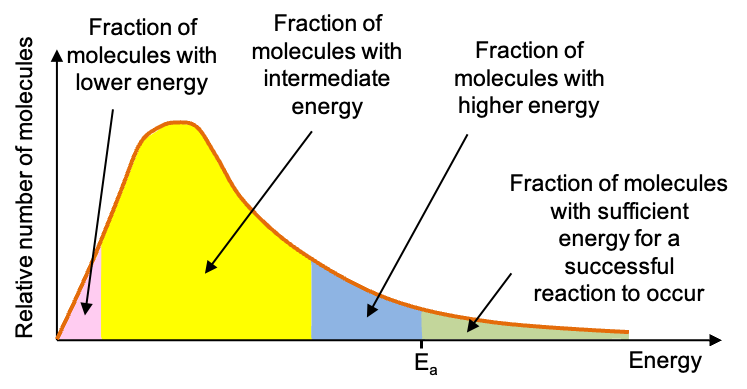
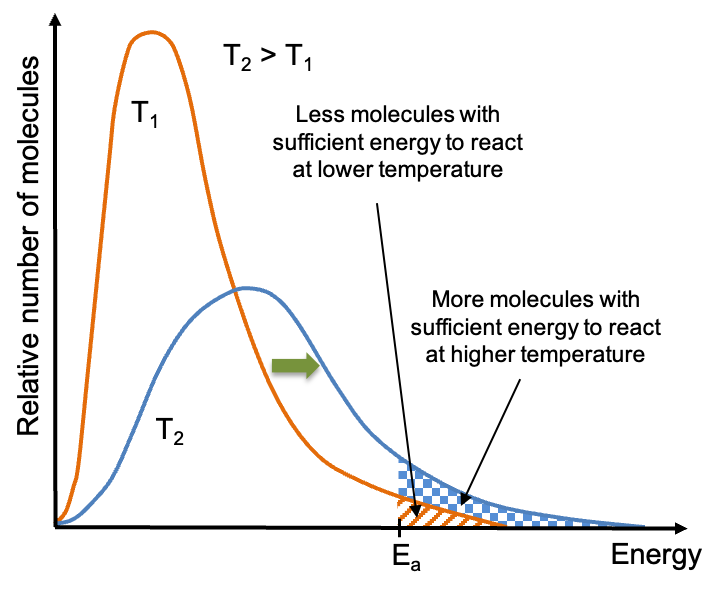
So, instead of the high activation energy route of two H2O2 colliding with each other to give oxygen, a suitably chosen catalyst offers a lower activation energy pathway of H2O2 colliding with bromide ions, and subsequently bromine, to produce oxygen. This is illustrated by the energy profile diagram above. With a lower activation energy, the rate of the reaction increases as a larger proportion of molecules have sufficient energy to react.

The same reaction can be catalysed by a heterogeneous catalyst like manganese dioxide. The mechanism for heterogeneous catalysis can be complex but normally involves the adsorption of reactants onto the surface of the catalyst, which changes the bond strengths of the reactants. The reactants, now being in close proximity to one another, react to form the products, which are desorbed or released from the surface of the catalyst (see diagram below).


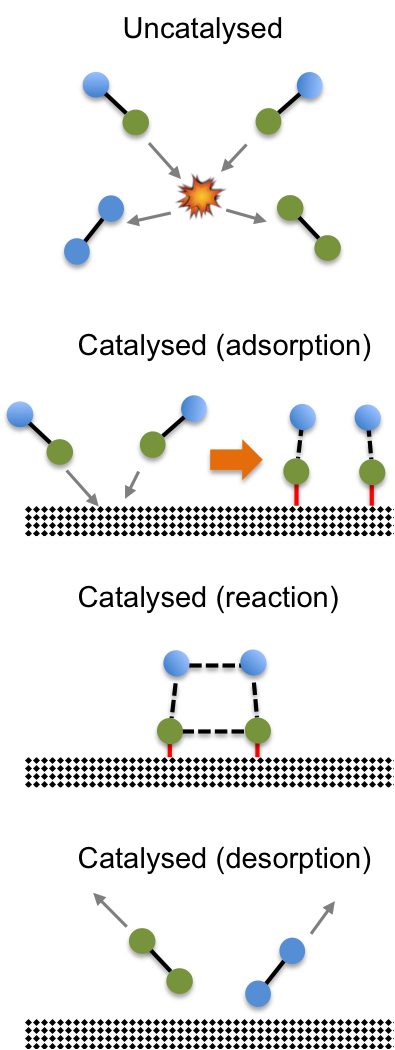
The catalyst, one again, participates in the reaction but remains chemically unaltered at the end of the reaction. Just like the example of the homogeneous catalyst, a heterogeneous catalyst offers an alternate reaction pathway for the reaction to occur. Instead of the high activation energy route of molecules colliding with one another to form products, a heterogeneous catalyst offers a lower activation energy pathway by allowing the molecules to be adsorbed onto its surface, where they react to form products.


Question

Use the Maxwell-Boltzmann distribution to represent the energy profile of molecules in a catalysed reaction.

Answer


In summary, a catalyst:

    1. increases the rate of a reaction because it lowers the activation energy of the reaction by offering an alternate pathway for the reaction to proceed. For a reversible reaction, a catalyst increases the rates of both the forward and reverse reactions by the same factor because the activation energy is lowered for the reaction in both directions.
    2. functions selectively, that is, it increases the rate of only certain reactions.
    3. is required only in small amounts to increase the rate of reactions as it is not consumed but reused in the process. Nevertheless, increasing the concentration of the catalyst further increases the rate of a single-step reaction, assuming that the reactants are in excess.
    4. may be inactivated by impurities over time.
    5. can be denatured by heat if the catalyst is an enzyme.

Some common catalysts include:

    1. Iron in the Haber process for the manufacture of ammonia
    2. Vanadium (V) oxide in the Contact process for the manufacture of sulphuric acid
    3. Platinum, palladium or rhodium in catalytic converters
    4. Nickel, platinum and palladium in the hydrogenation of alkenes to alkanes
    5. Phosphoric acid on silica for the hydration of alkenes to alcohols
    6. Concentrated acids for esterification
    7. Biological enzymes produced by yeast in the conversion of sugar or starch to ethanol


Previous article: Effect of temperature on the rate of a reaction
Content page of basic chemical kinetics
Content page of Basic chemistry
Main content page

Measuring the rate of a reaction

There are many ways to measure the rate of a reaction, some of which are depicted in the diagram below.


The rate of a reaction that produces a gas can be monitored by measuring the volume of gas produced at different time with a syringe, or by noting the pressure of the gas at various time intervals with a pressure gauge (A). Another way to determine the rate of a reaction is to measure the change in mass of a reaction mixture over time (B).  We can also measure the rate of a reaction via colorimetry (C) if a reacting species is coloured, and by titrimetric methods (D) if a reacting species can be oxidised or reduced by a titrant.

The rate of reaction between hydrochloric acid and calcium carbonate to give carbon dioxide is an example that can be determined by either method A or B.

2H_3O^+(aq)+CaCO_3(s)\rightarrow Ca^{2+}(aq)+CO_2(g)+3H_2O(l)

With respect to the syringe method A, the volumes of CO2 recorded are plotted against time (see diagram below), where the gradient at any point on the curve is the change of the amount of product versus the change in time, i.e. the rate of the reaction given by eq1.

The graph shows that the gradient is the steepest at the beginning of the reaction, t1, which means that the rate of reaction is fastest at the beginning. As the reaction progresses, the gradient decreases at t2 and t3, implying that the rate of reaction is decreasing. This is due to decreasing concentration of reactants, which are converted to products over time. Finally at t4, the gradient is zero, signifying that the reaction has stopped.

The above rates that are measured at specific times of the reaction are called instantaneous rates of reaction. We can also measure the average rate of reaction over a certain period of time just like we measure the average speed of a car over a certain stretch of a journey. For example, the average rate of reaction for the production of CO2 over the 1st five minutes of the reaction is:

rate=\frac{V_{CO_2,300}-V_{CO_2,0}}{(5\times 60)-0}

where V_{CO_2,x} is the volume of CO2 at x seconds.

Since a reaction’s rate generally decreases over time, we need a way to compare the rates of reaction between different reactions. This can be done using the initial rate of reaction, which happens to be a very useful analytical tool in chemical kinetics. Conceptually, the initial rate of reaction is the rate of reaction just after the start of the reaction when t ≈ 0, i.e.we measure the initial rate of reaction immediately after the beginning of the reaction. As elaborated in subsequent sections, this is a good reference point to compare the rates of reaction of reactants with different concentrations because their concentrations are assumed to be approximately the same as that before the start of their respective reactions.


Next article: Collision theory
Previous article: OVerview
Content page of basic chemical kinetics
Content page of Basic chemistry
Main content page

Partial pressure

John Dalton, an English chemist, experimented on the behaviour of gas mixtures in 1801 and concluded that:

The total pressure exerted by a mixture of non-reacting gases is equal to the sum of the partial pressures of each gas.

This became the Dalton’s law of partial pressures. The law can be rationalised for an ideal gas, which is described by the ideal gas law, pV = nRT.

Consider a mixture of ideal gases in a rigid container at constant temperature. Since ideal gas particles are assumed to be point masses with elastic collisions and no intermolecular forces of interaction, they are expected to collide onto the walls of the container independently from one another in the mixture. The total pressure exerted by the gas mixture on the walls of the container is therefore proportional to the total number of particles of ideal gases in the container. The ideal gas law for a mixture of ideal gases then becomes:

p_T=\left ( n_1+n_2+...n_i \right )\frac{RT}{V}=\frac{RT}{V}\sum_in_i\; \; \; \; \; \; \; \; 16

where pT is the total pressure of the gas mixture and ni is the number of moles of gas i in the mixture. Expanding eq16, we have:

p_T=n_1\frac{RT}{V}+n_2\frac{RT}{V}+...+n_i\frac{RT}{V}=p_1+p_2+...p_i=\sum_ip_i\; \; \; \;\; \; \; \; 17

where pi is known as the partial pressure of gas i:

p_i=n_i\frac{RT}{V}\; \; \; \; \; \; \; \; 18

Dividing eq18 with eq16 and rearranging, we have

p_i=x_ip_T\; \; \; \; \; \; \; \; 19

where x_i=\frac{n_i}{\sum_in_i}, i.e. the mole fraction of gas i.

Even though eq17 and eq19 are derived from the ideal gas law, they are applicable to real gases in many situations.


Question

What is the partial pressure of He in a balloon that is filled with He and 0.410 atm of N2, assuming atmospheric pressure is 760.0 mmHg?

Answer

Since 760.0 mmHg = 1.000 atm, pHe = 1.000 – 0.410 = 0.59 atm


Previous article: Ideal gas law
Content page of gas laws
Content page of Basic chemistry
Main content page

Boyle’s law

Robert Boyle, an Irish chemist, studied the relationship between the pressure and volume of a gas in 1662 by trapping a quantity of air in the close-end of a J-shaped tube of known cross sectional area with mercury (see diagram below).

In the experiment, pressure exerted on the trapped gas equals the atmospheric pressure (760 mmHg) plus the pressure exerted by the column of mercury, pi, which is varied by pouring mercury into the longer arm of the tube via the open-end.

Boyle found that the product of the pressure and volume of a fixed amount of gas was constant at a given temperature.

pV=k_1\; \; \; \; \; \; \; \; 1

where k1 is the proportionality constant. Eq1 is known as Boyle’s law, which states:

The volume of a given mass of gas is inversely proportional to its pressure at constant temperature

A plot of eq1 in terms of p versus V gives a hyperbola with the coordinate axes as asymptotes, while that of p versus 1/V produces a straight line with a gradient of k1 and an intercept at the origin.

Since p1V1 = k1 and p2V2 = k1, Boyle’s law can also be expressed as

p_!V_1=p_2V_2\; \; \; \; \; \; \; \; 2


Question

The volume of a bubble at the bottom of a lake with a depth of 30.0 m is 7.0 cm3. Assuming temperature remains constant, what is the bubble’s volume when it reaches the surface, where atmospheric pressure is equal to the pressure under 10.0 m of water?

Answer

Using eq2,  V_2=\frac{(30.0+10.0)\times 7.0}{10.0}=28\: cm^3


next article: Charles’s law
Previous article: Overview
Content page of gas laws
Content page of Basic chemistry
Main content page

Gas laws: overview

Gas laws are mathematical expressions that describe the relationships between physical properties of a gas. These properties include pressure, volume, temperature and the amount of substance (number of moles).

The discovery of gas laws at the end of the 18th century revolutionises our understanding of the behaviour of gases. In subsequent articles, we shall discuss four gas laws, namely, Boyle’s law, Charles’ law, Gay-Lussac’s law and Avogadro’s law, all of which combine to give the Ideal gas law.


next article: boyle’s law
Content page of gas laws
Content page of Basic chemistry
Main content page

Charles’s law

In 1787, many years after Robert Boyle’s discovery, Jacques Charles, a French scientist, who was a balloon enthusiast, tried measuring the volumes of a balloon that was filled with a gas at various temperatures. He noticed that the volume of the balloon increases linearly with the temperature of the gas on the Celsius scale.

A modern version of Charles’ experiment uses a capillary tube immersed in a temperature controlled water bath (see diagram below). Air is trapped between the close-end of the tube and a column of mercury, with the open-end of the tube exposed to the atmosphere. The pressure exerted on the gas is therefore constant as the gas expands with increasing temperature T.

The linear function can be expressed as:

V=mT+c\; \; \; \; \; \; \; \; 3

where m is the gradient of the line and c is the intercept the line makes with the vertical axis.

When the experiment is repeated with different gases at standard atmospheric pressure, the plots of V against T always extrapolate to -273.15 oC at zero volume (see graph below).

Since c is the volume of the gas at zero degrees Celsius, V0, we can rewrite eq3 as

V=mT+V_0\; \; \; \; \; \; \; \; 4

The gradient of the line is

m=\frac{V_0-0}{0-(-273.15)}=\frac{V_0}{273.15}\; \; \; \; \; \; \; \; 5

Substituting eq5 in eq4,

V=V_0(1+\alpha T)\; \; \; \; \; \; \; \; 6

where \alpha=\frac{1}{273.15}

In 1848, William Thompson (Lord Kelvin), a British scientist, proposed that the state at -273.15 oC is the lowest temperature that could be achieved theoretically and suggested a new temperature scale called the absolute thermometric scale (also known as the Kelvin scale), which is related to the Celsius scale by:

K=\: ^oC+273.15

Thomson named the temperature of -273.15 oC: absolute zero (0 Kelvin). A new graph can be plotted (see diagram below) where volume is now directly proportional to temperature in Kelvin, i.e.

V=k_2T\; \; \; \; \; \; \; \; 7

where k2 is the proportionality constant.

Eq7 is eventually called Charles’ law, in Jacques Charles’ honour. It states:

The volume of a given mass of gas is directly proportional to its absolute temperature (K) at constant pressure

Since V1 = k2T and V2 = k2T2, Charles’ law can also be expressed as

\frac{V_1}{T_1}=\frac{V_2}{T_2}\; \; \; \; \; \; \; \; 8

Note that eq6 is also known as Charles’ law but with T in Celsius. It is less often used than eq7 or eq8.


Question

Whether the VT graph is plotted using the Celsius scale or the Kelvin scale, it shows that the temperature of -273.15 oC or 0 K corresponds to V = 0, which does not seem possible as the gas would have liquefied (V ≠ 0) before reaching that temperature. How do we explain this?

Answer

The Gay-Lussac experiment is conducted at a relatively low pressure, where the gas is assumed to behave ideally (see this article for details). In reality, a gas exhibits properties that deviate from ideality and requires a different equation for description (see this intermediate level article for details).


next article: Gay-Lussac’s law
Previous article: Boyle’s law
Content page of gas laws
Content page of Basic chemistry
Main content page