The effect of concentration (or pressure) on the rate of a reaction is a key factor in chemical kinetics, as higher concentrations or pressures typically increase the frequency of collisions between reactant molecules, leading to faster reaction rates.
Consider the reaction between an acid and a strip of magnesium:
When we increase the concentration of the acid, we increase the number of hydroxonium ions per unit volume. This leads to a higher frequency of collisions between the hydroxonium ions and the magnesium strip, which in turn increases the probability of collisions occurring with the correct orientation and with energies equal or greater than the activation energy required for the reaction to take place. Similarly, for the reaction , an amount of N2O4 that exerts a higher pressure on the walls of a piston chamber implies that more N2O4 molecules within the bulk are colliding with one another effectively per unit time. A higher pressure can be obtained by injecting more N2O4 into the chamber or decreasing the volume of the chamber. Therefore, an increase in the concentration (or pressure) of reactants increases the rate of a reaction.

Question
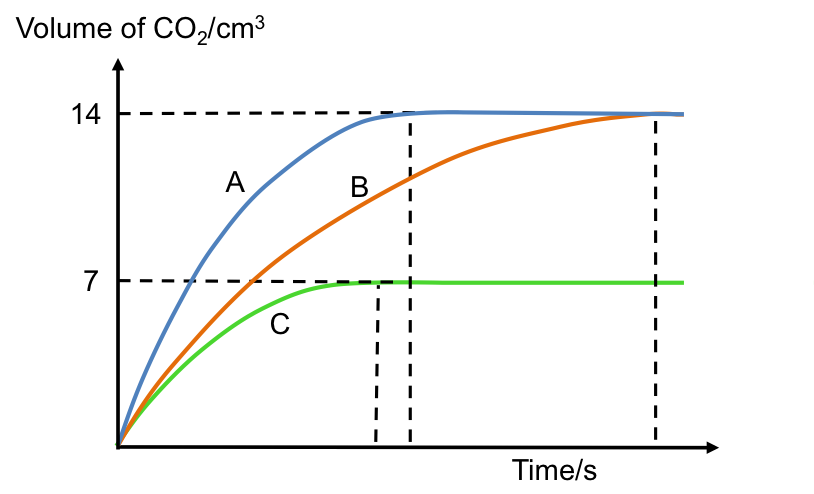
The volumes of CO2 produced from the reaction of excess CaCO3 with 3 different samples of HCl are shown in the graph above. Which curve corresponds to:
-
- 40 cm3 of 0.01 M of HCl?
- 20 cm3 of 0.02 M of HCl?
- 20 cm3 of 0.01 M of HCl?
Answer
-
- B
- A
- C
Curve A corresponds to a sample of HCl that is most concentrated, as it has the highest initial rate of reaction, i.e. steepest tangent of the graph at t = 0, and therefore describes the reaction between CaCO3 and sample 2. The samples of acid for Curves A and B consist of the same number of moles of HCl because both curves produce the same amount of CO2. So, if curve A is generated by sample 2, curve B must correspond to sample 1. Furthermore, curve B has a lower initial rate of reaction than curve A, as it has half the concentration of HCl.
Since CaCO3 is in excess, HCl is the limiting reactant, which means that curve C must be produced by a sample of acid that has half the number of moles of HCl as compared to curves A and B. Sample 3 fits this description. Moreover, as samples 1 and 3 have the same concentration of HCl, their reaction with CaCO3 should approximately proceed with the same initial rate of reaction, which is validated by the gradients of curves B and C at the origin.
Lastly, because sample 1 has the largest volume of acid versus the other two samples, it is expected to take the longest time to completely react with CaCO3. This is confirmed by the time curve B takes to level off.