Photoelectron Spectroscopy (PES) is an analytical technique that measures the kinetic energies of electrons emitted from a substance when it is irradiated with electromagnetic radiation, revealing information about the substance’s electronic structure and composition.
This technique is based on the photoelectric effect, in which photons striking either isolated gas-phase atoms or the surface of a solid material eject electrons. By measuring the kinetic energy () of the emitted electrons for a given incident photon frequency
, scientists can calculate their ionisation energies
(also known as binding energy) using the equation:
where
is the photon energy (
is the Planck’s constant).
is the measured kinetic energy of the
-th emitted electron of mass
and velocity
.
is the ionisation energy of the
-th electron. According to Koopmans’ theorem, this value is approximately equal to the negative of the energy of the occupied atomic or molecular orbital from which the electron was removed.
In atoms, electrons closer to the nucleus have higher ionisation energies because they experience stronger electrostatic attraction to the nucleus. As a result, their measured kinetic energies produce characteristic peaks in the photoelectron spectrum corresponding to the orbital energies, with core orbitals such as 1s appearing at much higher ionisation energies than outer orbitals such as 2s or 2p. By analysing the positions of these peaks, the energies of individual atomic orbitals can be determined.

Question
Use Coulomb’s law to explain why electrons closer to the nucleus have higher ionisation energies.
Answer
Coulomb’s law is given by
where
is the nuclear charge, while
is the charge of an electron,
is the attractive force between the two charges,
is the distance between the electron and the nucleus, and
is a constant.
According to Coulomb’s law, electrons closer to the nucleus (smaller ) experience a stronger attractive force
from the nucleus. Therefore, more energy is required to remove these electrons.
Similarly, PES is useful in studying molecular orbitals. When a molecule is irradiated, electrons are removed from bonding, nonbonding or antibonding molecular orbitals. Each molecular orbital gives rise to a separate peak in the spectrum. The first peak in a molecular PES spectrum usually corresponds to the highest occupied molecular orbital (HOMO), since these electrons require the least energy to remove. Peaks at higher ionisation energies correspond to lower-energy occupied orbitals. By comparing the experimental spectrum with theoretical calculations (e.g. using the Hartree-Fock method), chemists can identify the nature and ordering of molecular orbitals. PES therefore provides valuable information about electronic structure, chemical bonding, orbital energies and the stability of atoms and molecules.
Generally, there are two main types of PES:
-
- Ultraviolet Photoelectron Spectroscopy (UPS) — uses ultraviolet light to study valence electrons and chemical bonding.
- X-ray Photoelectron Spectroscopy (XPS) — uses X-rays to analyse elemental composition and oxidation states.
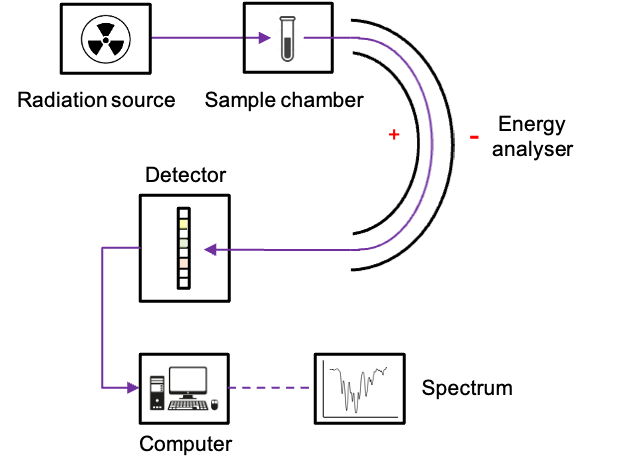
A typical photoelectron spectrometer (see above diagram) comprises of the following parts:
-
- Radiation Source: It provides photons of known energy to irradiate the sample.
- In UPS, ultraviolet lamps such as helium discharge lamps are commonly used. The lamp contains low-pressure He gas and two electrodes connected to a high-voltage power supply. When a sufficiently large potential difference is applied across the electrodes, the gas becomes ionised, and the accelerated electrons collide with He atoms, exciting their electrons to higher energy levels. As the excited He atoms relax back to lower energy states, they emit characteristic ultraviolet radiation. The most commonly used emission lines are He I (21.2 eV) and He II (40.8 eV).
- In XPS, X-ray sources, such as
radiation, are employed. The radiation is generated in an X-ray tube, which consists of a hot tungsten filament (cathode) that emits electrons. These electrons are then accelerated towards a metal anode (e.g. Mg) by applying a large potential difference between electrodes. For
, the applied voltage allows the accelerated electrons to gain sufficient kinetic energy to eject an
(
–shell) electron from the anode. Subsequently an
(
-shell) electron drops to the
or
).
- Sample Chamber: The sample is placed inside an ultra-high vacuum chamber to prevent emitted electrons from colliding with air molecules. The vacuum also keeps the sample surface clean and uncontaminated. The chamber contains openings that allow the incident radiation to enter and the emitted electrons to pass into the energy analyser.
- Energy Analyser: This consists of electrostatically charged plates shaped into hemispheres that deflect the paths of the electrons exiting the sample chamber according to their velocities. Only electrons with a specific kinetic energy follow the correct curved trajectory that allows them to pass through the analyser and reach the detector. Electrons with kinetic energies that are too high or too low are deflected either too little or too strongly and therefore collide with the analyser walls instead of reaching the detector. By varying the potential difference between the hemispherical plates, the analyser selectively allows electrons of different kinetic energies to reach the detector.
- Detector: The detector, such as microchannel plates (MCPs), records the number of electrons transmitted by the analyser at different kinetic energies. An MCP is a thin glass disk riddled with millions of microscopic tubes called channels. An incoming photoelectron enters a channel and collides with its resistive glass wall, which is coated with a material that emits 2–3 secondary electrons each time it is struck. However, this small number of electrons is insufficient to generate an appreciable signal. Therefore, the secondary electrons are accelerated further down the channel by an applied electric potential, causing repeated collisions with the channel walls and producing an electron cascade. By the time the cascade reaches the end of the channel, a single incoming electron has been amplified into a measurable pulse of electrons. The resulting electrical signal is then collected and counted by the detector electronics. By repeatedly varying the potential difference between the hemispherical plates over a range of energies and recording the corresponding detector signal, a photoelectron spectrum is produced.
- Radiation Source: It provides photons of known energy to irradiate the sample.
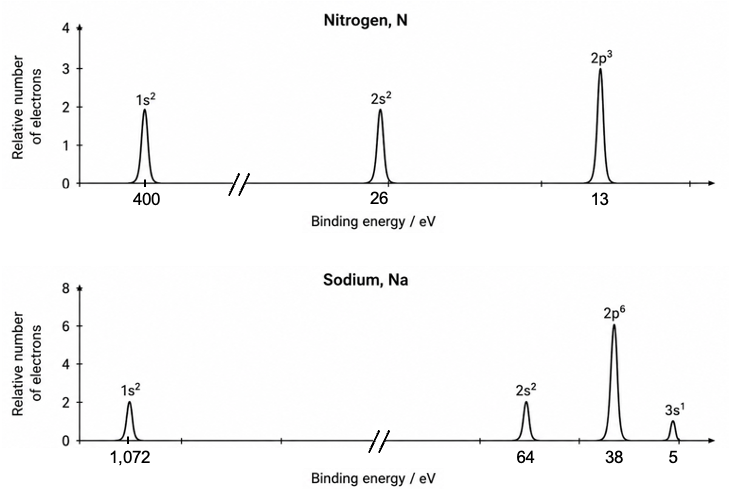
The vertical axis of a typical photoelectron spectrum corresponds to the relative number of electrons (peak intensity), while the horizontal axis may be labelled “ionisation energy” or “binding energy”. Unlike ionisation energy scales, binding energy scales are often plotted in reverse (with high energy on the left and lower energy on the right). Photoelectron spectra in high school textbooks are usually simplified and depicted with isolated peaks. For example, the photoelectron spectrum of nitrogen consists of three peaks corresponding to electrons residing in the 1s, 2s and 2p orbitals, while that of sodium has four peaks (see diagram below).
In reality, a sample of nitrogen exists primarily as diatomic N2 molecules rather than isolated atoms. As a result, the observed photoelectron spectrum is more complex than the simplified atomic representation shown in introductory treatments. In molecular systems, atomic orbitals combine to form molecular orbitals, and electrons are removed from these molecular orbitals during photoionisation. Consequently, the spectrum of N2 contains peaks associated with bonding and antibonding molecular orbitals rather than purely atomic 1s, 2s, and 2p orbitals (see diagram below).
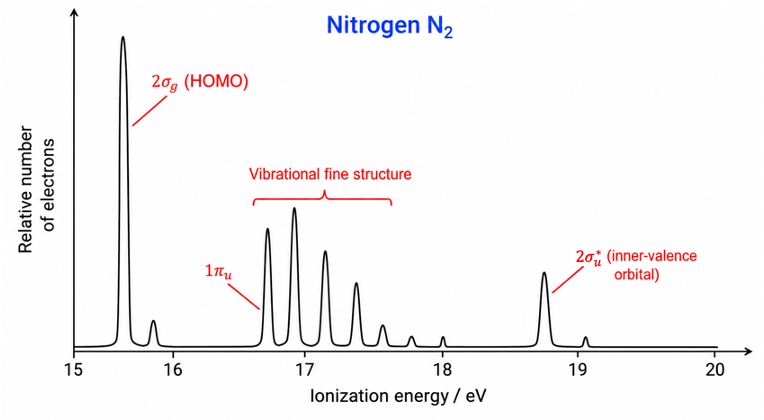
In addition, real photoelectron spectra are affected by several other factors, including spin–orbit splitting, vibrational fine structure, instrumental resolution, and interactions between emitted electrons and neighbouring atoms. Therefore, experimentally obtained spectra often display broadened or overlapping peaks instead of perfectly sharp lines.
Similarly, a sample of sodium consists of sodium crystals instead of isolated atoms. In the solid state, the outer 3s electrons are not confined to individual sodium atoms but become delocalised throughout the crystal lattice, forming electronic bands. As a result, the photoelectron spectrum of metallic sodium differs from the simplified atomic spectrum typically presented in introductory discussions. Instead of discrete atomic energy levels alone, the spectrum reflects the band structure of the solid, including the partially filled valence band formed by the 3s electrons. Consequently, experimentally measured spectra of sodium metal often exhibit broadened features and additional fine structure arising from interactions between neighbouring atoms in the crystal lattice.
Despite these complexities, simplified spectra remain useful for introducing the relationship between electron configuration and binding energy.
Question
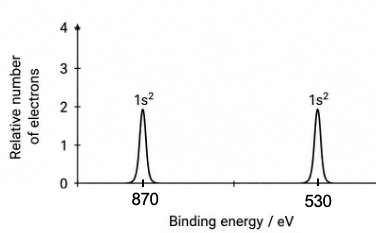
The photoelectron spectrum above displays the 1s peaks for two different chemical species, Ne and O2-, both of which share the same electron configuration 1s22s22p6. Use Coulomb’s law to identify which peak corresponds to Ne.
Answer
The Ne peak is the one with the higher binding energy. Electrons in both species experience the same shielding effects because they have the same electron configuration. However, Ne has a greater nuclear charge than O2- because the Ne nucleus contains 10 protons, whereas the oxygen nucleus contains only 8 protons. According to Coulomb’s law, a larger nuclear charge results in a stronger attractive force between the nucleus and the electrons. Therefore, the electrons in Ne are held more strongly by the nucleus and require more energy to remove. Hence, Ne corresponds to the peak with the higher binding energy.
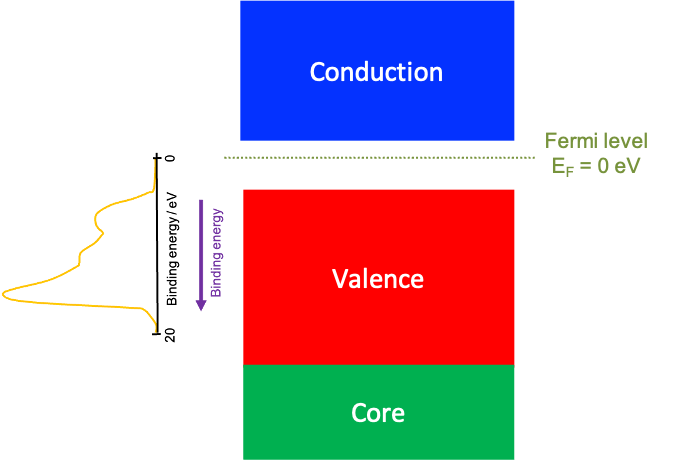
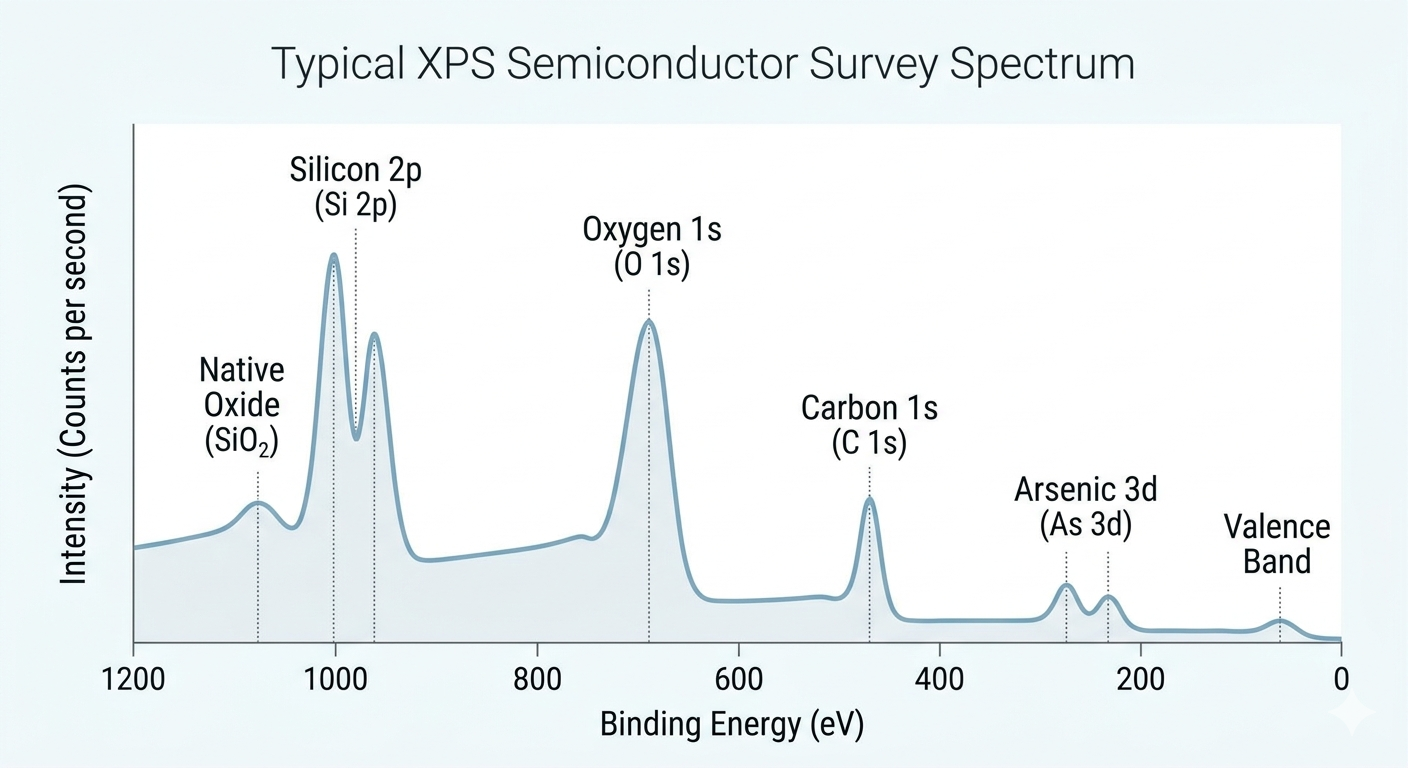
One important application of PES is the analysis of semiconductors. Semiconductors function because of the gap between the valence band (where electrons are bound) and the conduction band (where electrons can move freely and conduct electricity). PES is uniquely suited to map these regions, where lower-energy UV photons in UPS eject electrons from the valence band. As a result, the Fermi Level EF can be measured relatively to the top of the valence band (see diagram above).
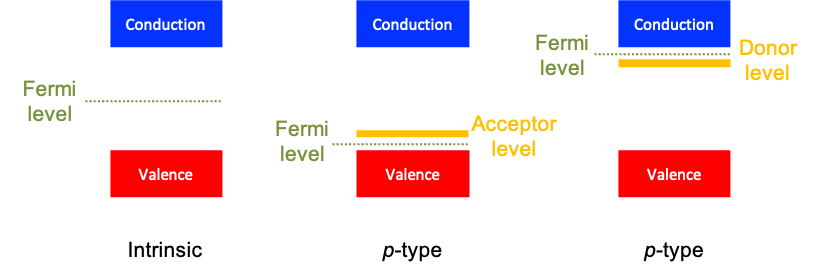
In an n-type semiconductor, the Fermi level shifts closer to the conduction band, whereas in a p-type semiconductor, it shifts closer to the valence band. PES can detect these shifts with high precision, allowing verification of whether the doping process was successful (see diagram above). In addition, higher-energy X-rays in XPS eject tightly bound core electrons, helping to identify the elements present in a semiconductor because each element has characteristic core-electron binding energies. Small shifts in these binding energies also reveal the chemical environment of the atoms, such as their oxidation states or the types of chemical bonds they form. This enables scientists to determine the composition of dopants, surface oxides, and other impurities in the semiconductor material (see diagram below, where carbon is an impurity and arsenic is a dopant). Therefore, PES serves as a powerful tool for analysing both the electronic structure and chemical composition of semiconductors.