We have explained the shape of a strong-base-to-strong-acid titration curve in a basic level article. We shall now describe the shape of a strong-base-to-weak-acid titration curve using simple equations like the Henderson-Hasselbalch equation. To do so, we need to analyse the curve at different stages of the titration. These stages are:
-
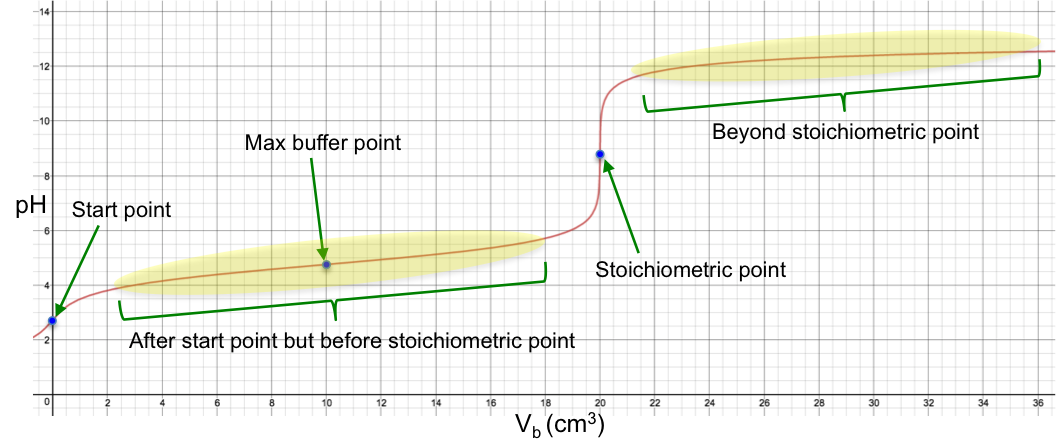
- Start point
- After start point but before stoichiometric point
- Maximum buffer capacity point
- Stoichiometric point
- Beyond stoichiometric point
Proceed to the next few articles to understand the mathematics and assumptions behind the formulae for the various stages of the pH curve.