Titration curves reveal important data of acid-base systems, like the pH of the stoichiometric point, pH at maximum buffer capacity, equilibrium constants, etc. They have different shapes that are governed by the equilibria of the acid, the base and water. In general, titrations are categorized into four groups:
-
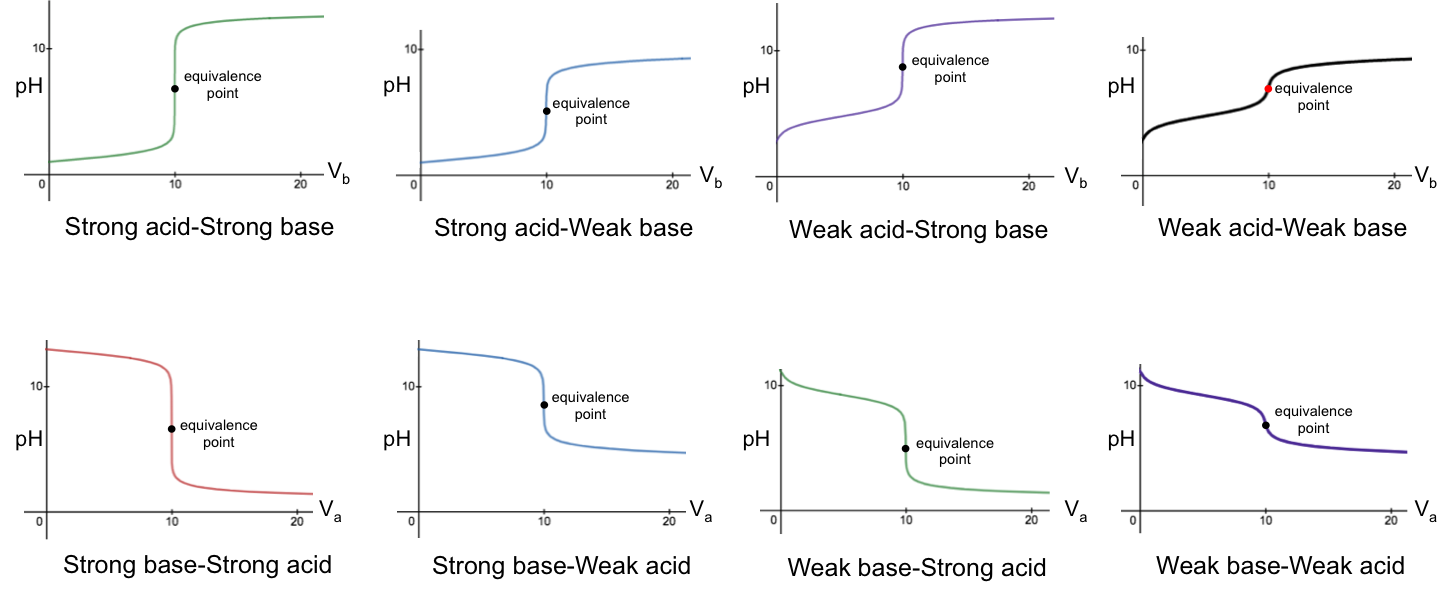
- Strong acid versus strong base
- Weak acid versus strong base
- Strong acid versus weak base
- Weak acid versus weak base
The pH versus volume profile of each group can be expressed explicitly with a unique pH titration curve formula. Knowing the formula for all categories of titration therefore allows us to mathematically explain the shape of the curves, including the reasons for the sharp change of pH near stoichiometric points. In the following derivation of pH curve equations of the four categories of titration, we shall assume that the activity of every chemical species is equivalent to its concentration.