A titration curve is a graphical representation of the pH of a solution in the course of an acid-base titration. The shape of the curve depends on the acid and base used. For a titration between a monoprotic acid and a monoprotic base, its pH curve has one of eight profiles as shown in the diagram below.
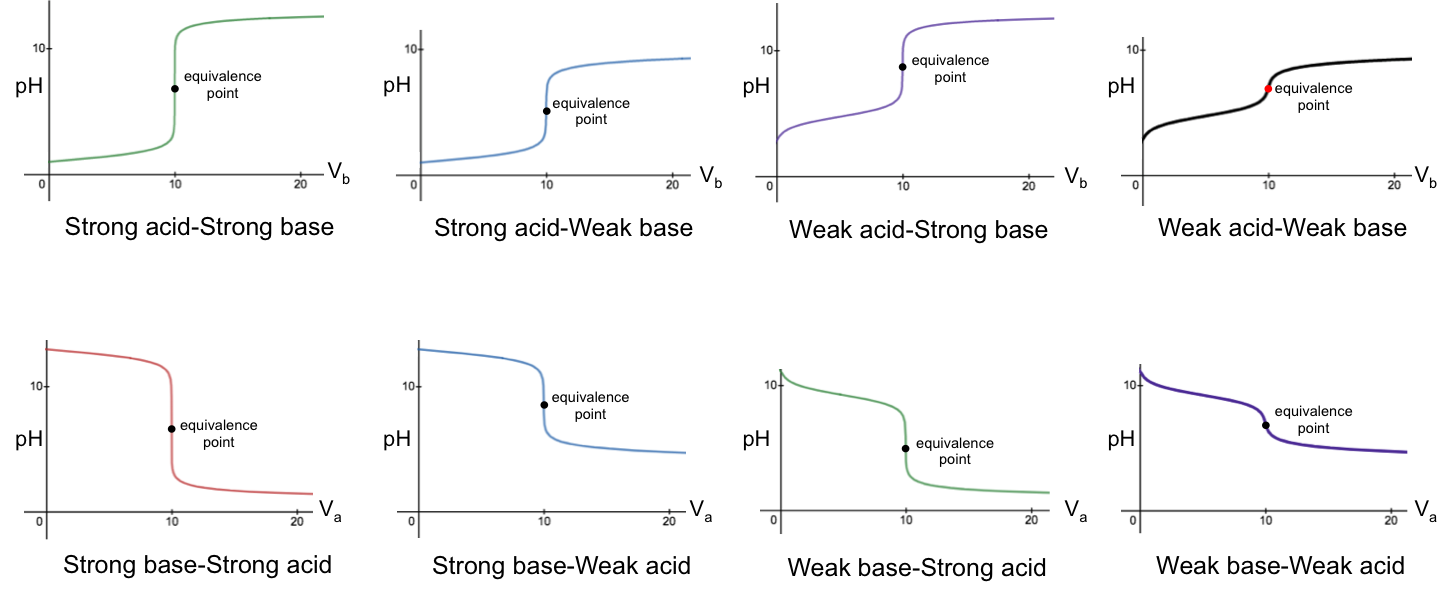
Evidently, a titration curve is a plot of the pH of the solution in the conical flask versus the volume of reagent added from the burette. The top four graphs refer to base-to-acid titrations (i.e. base added to acid), while the bottom four graphs depict acid-to-base titrations.

The characteristics of the base-to-acid graphs are:
-
- low pH at the start of the titration
- pH of acid solution in the flask increases gradually as base is continuously added
- a sharp increase in pH at or near the equivalence point
- pH of solution in the flask continues to increase gradually thereafter

Question
Why is the shape of the pH titration curve sigmoidal (‘S’-shaped) and why is there a sharp change in pH at the equivalence point?
Answer
We shall use the example of a strong base to strong acid titration for this answer. Most students are familiar with the curve y = –logx (the reflection of y = logx along the horizontal axis), which has a vertical asymptote at x = 0 (Fig I). Let’s replace the variables y and x with pH and [H+] respectively, and adjust the vertical axis from 0 to 14 (the typical pH range). As a result, the corresponding domain is 0 < x ≤ 1 (Fig II).
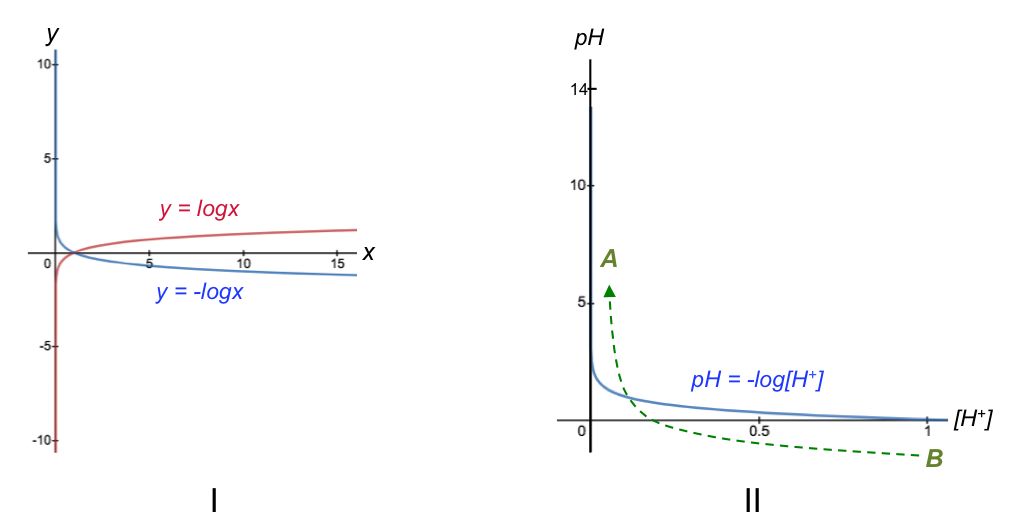
[H+] increases from left to right along the horizontal axis in Fig II. However, the horizontal axis of a base-to-acid pH curve refers to the volume of base added (see diagram at the top of the page), which reduces the concentration of H+ in the conical flask as the titration progresses (i.e. Vb is not proportional to [H+], but to 1/[H+] ). So, the titration progresses from B to A instead of A to B with reference to Fig II. This implies that we should replot the graph in Fig II using 1/[H+] as the horizontal axis, with a corresponding domain of 1 ≤ x < ∞ (Fig III).
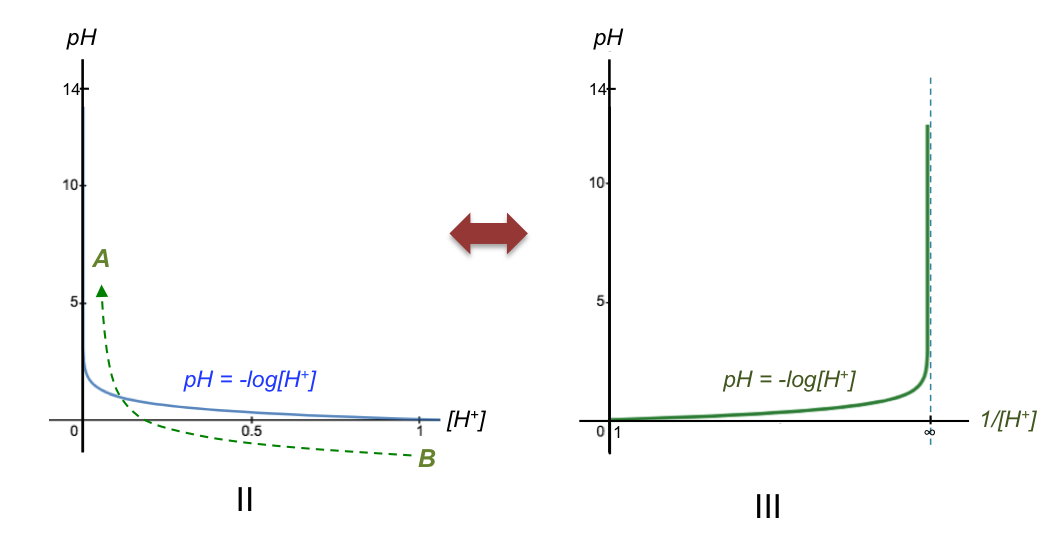
The vertical asymptote now intersects the horizontal axis at the equivalence point (Ep) where [H+] → 0, corresponding to 1/[H+] → ∞ in Fig III. Since Vb is proportional to 1/[H+], we can relabel the horizontal axis as Vb (Fig IIIa). The reason for the sharp change in pH is therefore due to the definition of pH being the negative logarithm of [H+] (we’ve merely transformed the horizontal axis from [H+] to Vb).
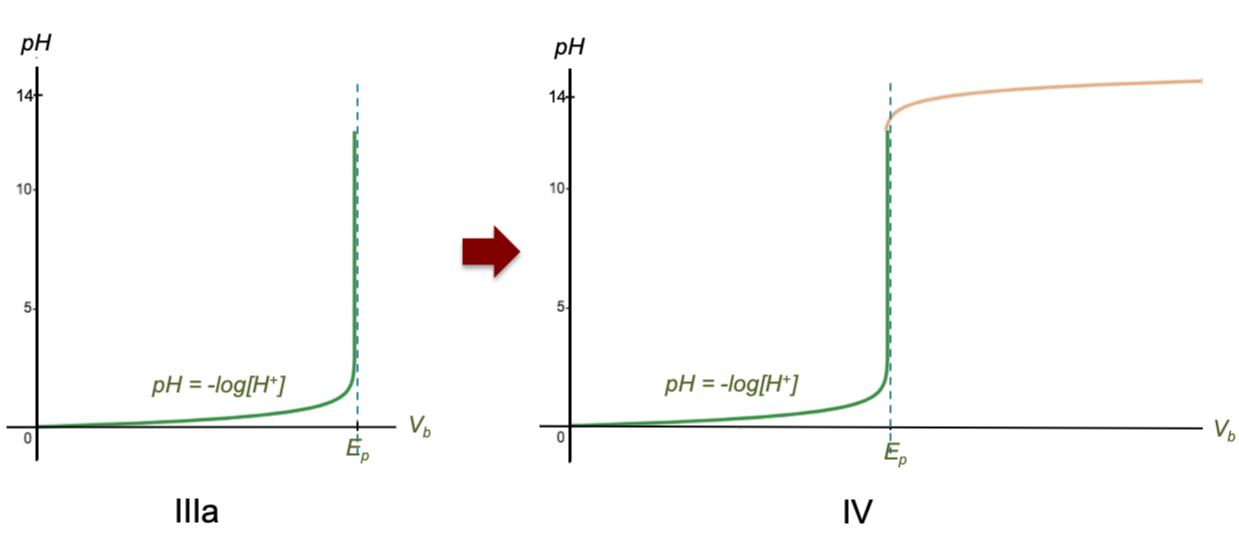
Next, [H+] doesn’t fall precisely to zero at and beyond the equivalence point due to minute presence of H+ from the dissociation of water molecules remaining in the solution. Therefore, as the curve bends vertically upwards, the value of pH does not increase infinitely but plateaus after the equivalence point, only increasing minimally as more base is added (see figure IV above). In other words, when the acid is completely neutralised by the base, water behaves like a very weak acid as more base is added, and the titration curve beyond the equivalence point represents the beginning of the titration of water with the base.
Using the above logic, the reverse-‘S’-shaped graph when a strong acid is added to a strong base can be similarly explained. If you are interested to understand the shape of a pH curve of a strong base to weak acid titration (or strong acid to weak base titration), read this article in the intermediate section. For mathematical formulas that describes the various titration curves, refer to the topic ‘Complete pH titration curves‘ in the advanced section.