In 1787, many years after Robert Boyle’s discovery, Jacques Charles, a French scientist, who was a balloon enthusiast, tried measuring the volumes of a balloon that was filled with a gas at various temperatures. He noticed that the volume of the balloon increases linearly with the temperature of the gas on the Celsius scale.
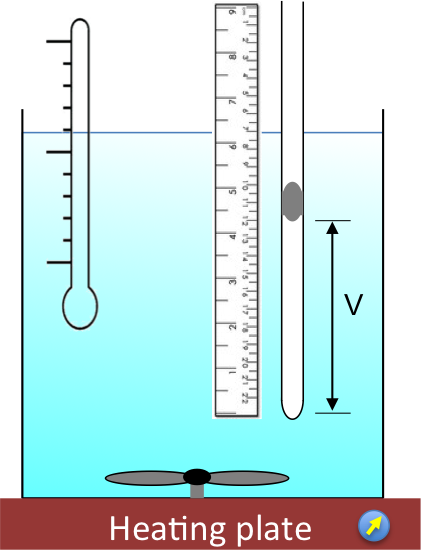
A modern version of Charles’ experiment uses a capillary tube immersed in a temperature controlled water bath (see diagram below). Air is trapped between the close-end of the tube and a column of mercury, with the open-end of the tube exposed to the atmosphere. The pressure exerted on the gas is therefore constant as the gas expands with increasing temperature T.
The linear function can be expressed as:
where m is the gradient of the line and c is the intercept the line makes with the vertical axis.
When the experiment is repeated with different gases at standard atmospheric pressure, the plots of V against T always extrapolate to -273.15 oC at zero volume (see graph below).
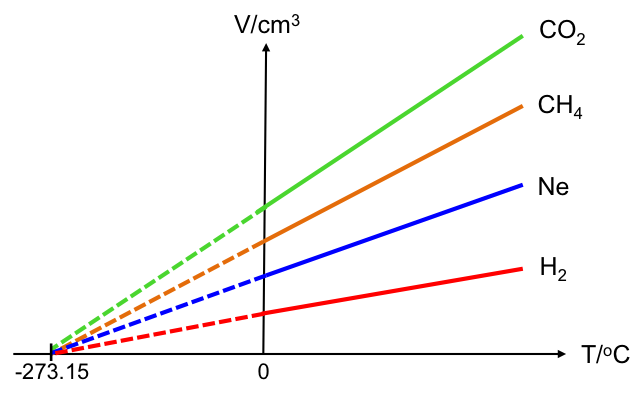
Since c is the volume of the gas at zero degrees Celsius, V0, we can rewrite eq3 as
The gradient of the line is
Substituting eq5 in eq4,
where
In 1848, William Thompson (Lord Kelvin), a British scientist, proposed that the state at -273.15 oC is the lowest temperature that could be achieved theoretically and suggested a new temperature scale called the absolute thermometric scale (also known as the Kelvin scale), which is related to the Celsius scale by:
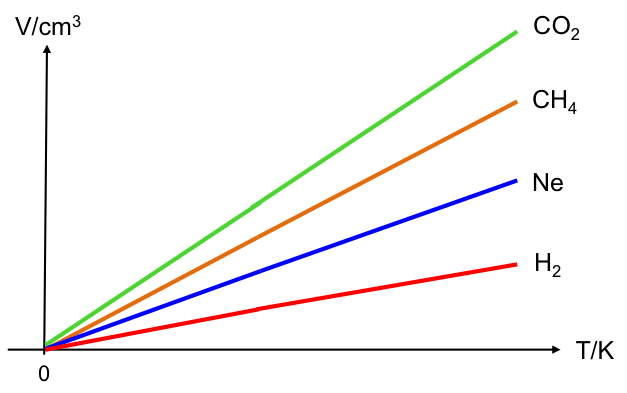
Thomson named the temperature of -273.15 oC: absolute zero (0 Kelvin). A new graph can be plotted (see diagram below) where volume is now directly proportional to temperature in Kelvin, i.e.
where k2 is the proportionality constant.
Eq7 is eventually called Charles’ law, in Jacques Charles’ honour. It states:
The volume of a given mass of gas is directly proportional to its absolute temperature (K) at constant pressure
Since V1 = k2T1 and V2 = k2T2, Charles’ law can also be expressed as
Note that eq6 is also known as Charles’ law but with T in Celsius. It is less often used than eq7 or eq8.

Question
Whether the V–T graph is plotted using the Celsius scale or the Kelvin scale, it shows that the temperature of -273.15 oC or 0 K corresponds to V = 0, which does not seem possible as the gas would have liquefied (V ≠ 0) before reaching that temperature. How do we explain this?
Answer
The Gay-Lussac experiment is conducted at a relatively low pressure, where the gas is assumed to behave ideally (see this article for details). In reality, a gas exhibits properties that deviate from ideality and requires a different equation for description (see this intermediate level article for details).