A phase diagram illustrates the equilibrium conditions — typically pressure versus temperature — under which a substance exists in different phases.
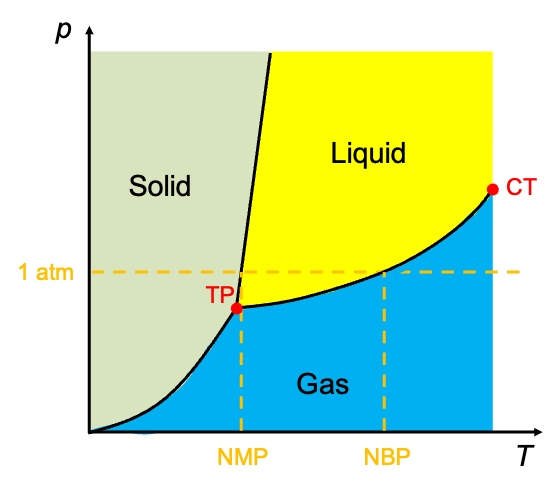
Defined as a distinct, homogeneous part of a system, a phase has uniform physical and chemical properties. The most common phases are solid, liquid, gas and plasma. Among these, solid and liquid are referred to as condensed phases, while the gas phase is often called the vapour phase. In the figure below, the phase diagram displays temperature on the horizontal axis and pressure on the vertical axis. The diagram is divided into regions, each representing the stable phase of a substance under specific temperature and pressure
conditions.
A phase transition takes place when a substance changes from one phase to another, typically due to variations in temperature or pressure. These transitions involve transformations in energy. For example, when a solid becomes a liquid, the process is known as melting. The temperature at which this change occurs under constant pressure is called the transition temperature.
Lines separating the regions in the diagram are known as phase boundaries. These boundaries represent the equilibrium conditions under which two phases coexist. For instance, the solid–liquid boundary marks the conditions at which solid and liquid phases are in equilibrium. At any point on a boundary, the substance can exist as a stable mixture of the two phases, provided that and
change infinitesimally. Since there is no net change in the amount of substance transforming between phases at equilibrium, the tendency for each phase to change is the same. In other words, the chemical potentials
of the two phases are equal at equilibrium

Question
Why must and
change infinitesimally when a substance is on a phase boundary?
Answer
An infinitesimal change in or
allows the system to adjust reversibly. For instance, if the temperature is raised slightly at the melting point, a small amount of solid will melt into liquid — maintaining equilibrium and remaining on the phase boundary as the system shifts slightly towards the liquid phase. However, if
or
changes by a noticeable amount, the substance will leave the phase boundary and enter a region where only one phase is stable. The system will then undergo a complete phase transition rather than coexistence.
A phase diagram contains valuable information about a substance. The triple point (TP) is the unique condition (specific temperature and pressure) at which all three phases — solid, liquid and gas — coexist in equilibrium. Every pure substance has a distinct triple point. This singular equilibrium state serves as a fixed reference for thermodynamic calculations (e.g. the triple point of water defines the Kelvin temperature scale). Located at the end of the liquid-gas boundary is the critical point (CT), beyond which the liquid and gas phases become indistinguishable (having equal density) and form a supercritical fluid.
The boiling point of the substance is the temperature at which the vapour pressure of a liquid equals the external pressure, resulting in vaporisation. It varies with pressure, with the normal boiling point (NBP) defined at 1 atm. Similarly, the melting point is the temperature at which a solid becomes a liquid under a given pressure, and the normal melting point (NMP) is again defined at 1 atm.
Sublimation can occur over a range of pressures and temperatures below the triple point. A solid sublimes when its vapour pressure equals or exceeds the surrounding partial pressure of its gaseous phase. Unlike melting and boiling points, sublimation does not have a single, universally agreed-upon “normal” condition. Nevertheless, the sublimation point of a substance is commonly referenced at 1 atm — for example, dry ice (solid CO₂) sublimes at -78.5 °C at 1 atm.
Liquid-gas and solid-gas boundaries
How is the phase diagram constructed? Each phase boundary is a mathematical function of temperature, with the Clasius-Clapeyron equation describing the liquid-gas boundary. Given that the enthalpy of vaporisation is positive and assuming it is independent of temperature, the equation can be integrated as follows:
which rearranges to
Eq170 is an exponential curve. If , it represents a smooth, upward-sloping curve, which is typical of the liquid-gas boundary. The curve truncates at the critical temperature, as the two phases become a uniform phase above this temperature.
Similarly, the solid-gas boundary is described by the Clasius-Clapeyron equation in the form:
Since the enthalpy of sublimation is also positive, and , the solid-gas boundary has a steeper gradient than the liquid-gas boundary.
Solid-liquid boundary
From eq148,
where the subscript denotes a molar quantity.
Substituting eq149a in eq172 gives
Since the chemical potentials of the solid phase and the liquid phase
are equal along the solid-liquid boundary,
which rearranges into the Clapeyron equation:
Substituting eq147, where at equilibrium, in eq174 yields
Integrating eq175, and assuming and
are independent of temperature, gives
Eq176 describes the solid-liquid boundary. For most substances, the change in molar volume upon melting is very small because solids and liquids are relatively incompressible. This makes the slope
very steep, which can often be approximated as a straight line in some substances.