A vibronic spectrum records simultaneous changes in the electronic and vibrational energies of molecules, whereas a ro-vibronic spectrum additionally includes resolved rotational energy changes.
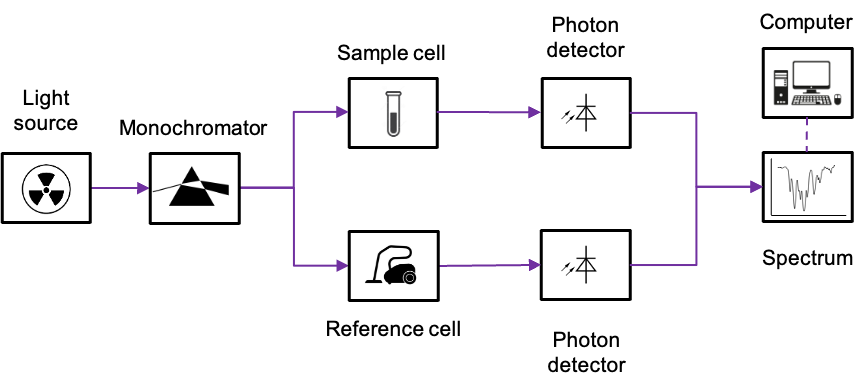
Unlike an atomic absorption spectrometer, which typically uses element-specific line sources such as hollow-cathode lamps, the spectrometers used to measure vibronic and ro-vibronic absorption spectra generally employ broadband continuous radiation sources (e.g. deuterium or tungsten lamps) together with monochromators to isolate the desired wavelength range (see diagram below).
Vibronic and ro-vibronic spectra can also be observed as emission spectra. In such cases, the sample molecules can be excited using:
-
- Electric discharges: Passing a high-voltage current through a low-pressure gaseous sample.
- Inductively coupled plasma arcs: Heating the sample to extremely high temperatures.
- Laser excitation: Using a laser tuned to a specific transition. The molecules absorb the laser light and then emit it as fluorescence, allowing for very “clean” ro-vibronic spectra.
- Electron beams: Bombarding the gas with high-energy electrons.
Electronic spectroscopic analyses of very large or heavy molecules, such a protein, usually produce vibronic spectra. In such cases, the rotational constants are so small that the rotational energy levels are closer together than the natural linewidth imposed by the Heisenberg uncertainty principle. Studies of molecules in the liquid or solid phase also result in broad vibronic bands because collisions and intermolecular interactions shorten the lifetimes of the excited states and broaden the spectral lines, preventing the individual rotational transitions from being resolved. Conversely, small molecules in the gaseous phase, like H2 or CO, have larger rotational constants and more widely spaced rotational energy levels, making ro-vibronic spectrum observable.
Consider the homonuclear diatomic molecule N2. Its first few electronic states are: (ground state),
(first excited state),
(next higher excited state),
(another higher excited state), and so on (click this link for derivation of term symbols). The transition
is forbidden due to the selection rule
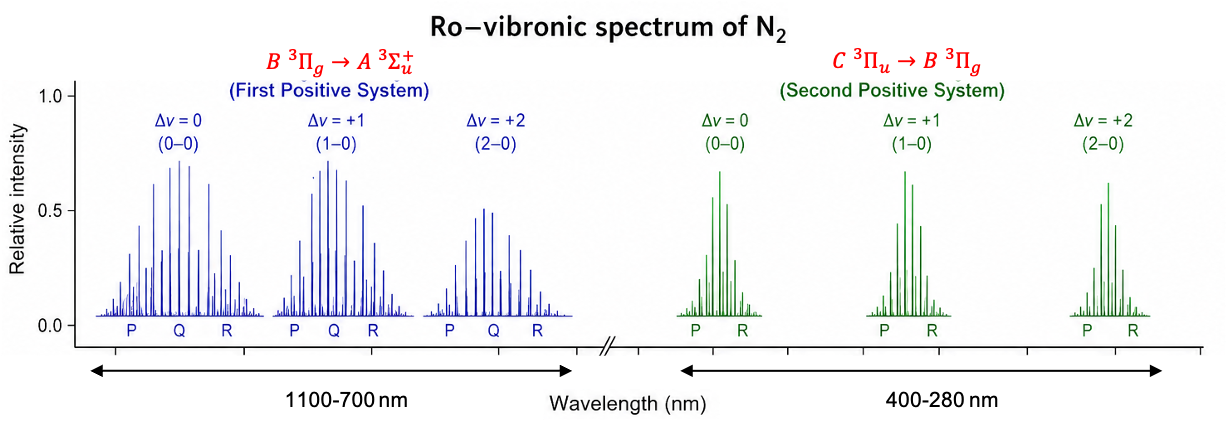
. Therefore, the first two observed emission spectroscopy transitions are
and
, which, along with their associated vibrational and rotational fine structures, are known as the first positive system and the second positive system respectively (see diagram above). For illustration purposes, three vibrational transitions (
,
and
), along with their associated rotational fine structures, are shown for each system. These emissions lines typically group into bands, with the wavelength corresponding to each vibrational transition located approximately at the band head (the point of highest intensity within a band). Notably, the parity rule
is satisfied for both systems, but the Q-branches are absent in the second positive system because
is forbidden for
transitions (see this link for details). In practice, these bands may overlap, forming a “forest of peaks” rather than distinct, well-separated bands.
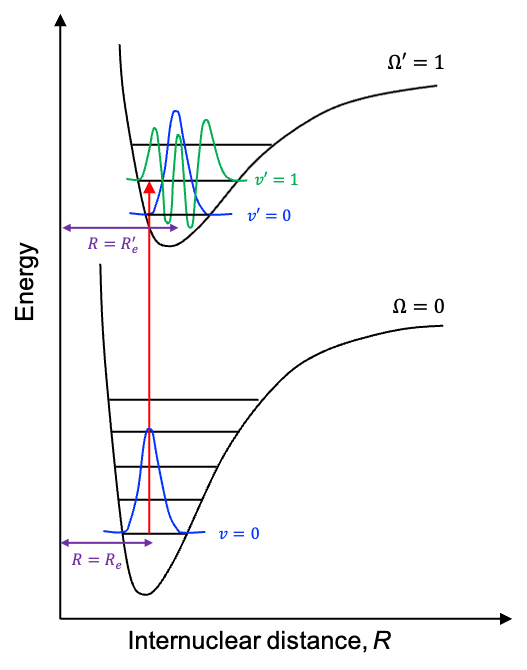
The intensities of the bands of any ro-vibronic spectrum vary according to the Frank-Condon principle, which states that because atomic nuclei are much more massive than electrons, an electronic transition occurs so rapidly that the nuclear configuration of the molecule remains practically unchanged during the process. In general, a molecule’s nuclear configuration is described by vibrational wavefunctions, each expressed as a function of the internuclear separation corresponding to a given electronic state, where the equilibrium separation
satisfies the relationship:
. For example, the
band for the
transition in the diagram below is expected to have a higher intensity than the
band.
This is because, classically, the amplitude of the wavefunction of an oscillator in an excited vibrational state is greatest near the turning points, where the nuclei move most slowly. In contrast, the ground-state wavefunction has its largest amplitude near . Since the vibrational transition intensity is proportional to the square of the overlap integral
, it is determined, according to the Frank-Condon principle, by the extent of overlap between the initial-state wavefunction and the final-state wavefunction lying vertically above it. Since
is constant for every rotational line within a given vibrational band, it acts as a global scaling factor. Consequently, the intensities of rotational fine structures within a higher-intensity vibrational band are generally higher than those within a lower-intensity vibrational band for a given electronic transition.