How does the titration curve of a strong acid versus a strong base compare with the titration curve of a weak acid versus a strong base?
Superimposing the weak acid versus strong base titration curve on the strong acid versus strong base titration curve, we have
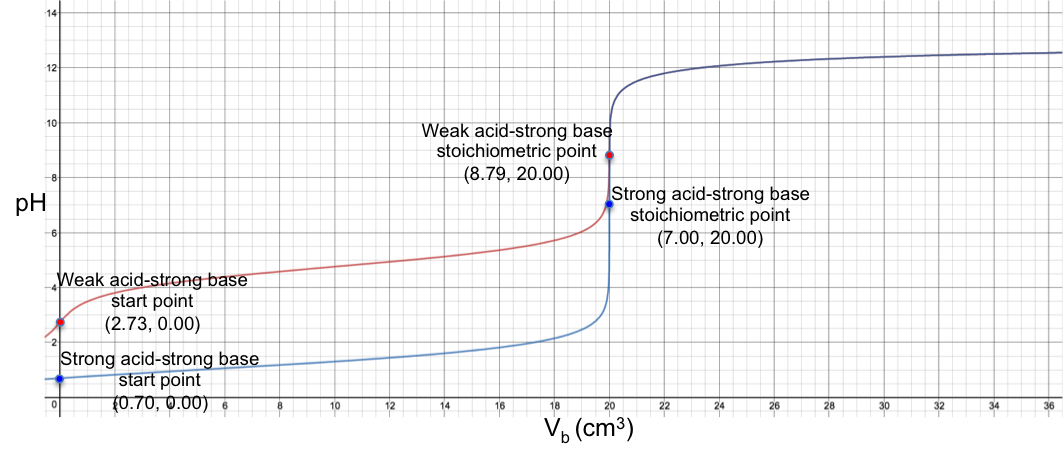
From the graph, the two curves appears to coalesce when pH > 8. This can be rationalised by comparing eq4 and eq8:
where the two equations are approximately the same when 10-pH → 0, i.e. at high pH. Note that the two curves do not actually coalesce and are still two separate curves when pH > 8 (discernible if the axes of the plot are scaled to a very high resolution).