A Pourbaix diagram is a reduction potential versus pH graph. It was invented by Marcel Pourbaix, a Belgian chemist, in the 1930s. A typical Pourbaix diagram illustrates the equilibria of electrochemical and non-electrochemical reactions. It consists of plots of equations derived either from the Nernst equation (for electrochemical reaction equilibria) or the equilibrium constant relation (for non-electrochemical reaction equilibria), with all reactions related to a particular metal or non-metal. For example, the equilibria of acidified water are:
E1 :
E2 :
with the following Nernst equations at rtp, ,
and
:
The Pourbaix diagram for acidified water is the ESHE-pH graph of eq71 and eq72:
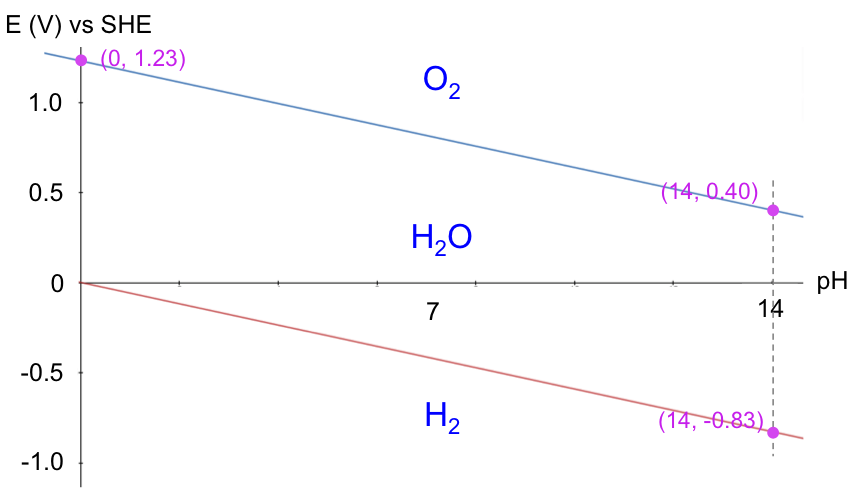

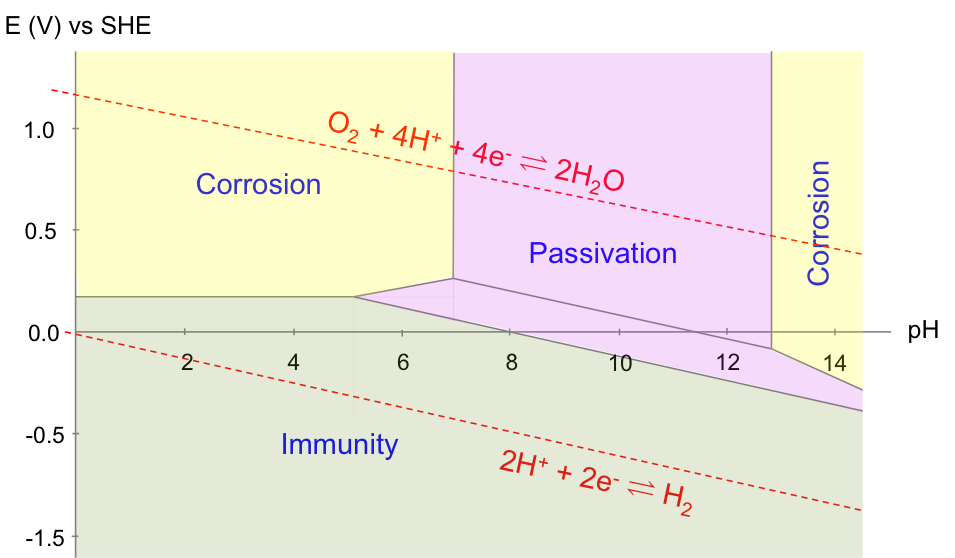
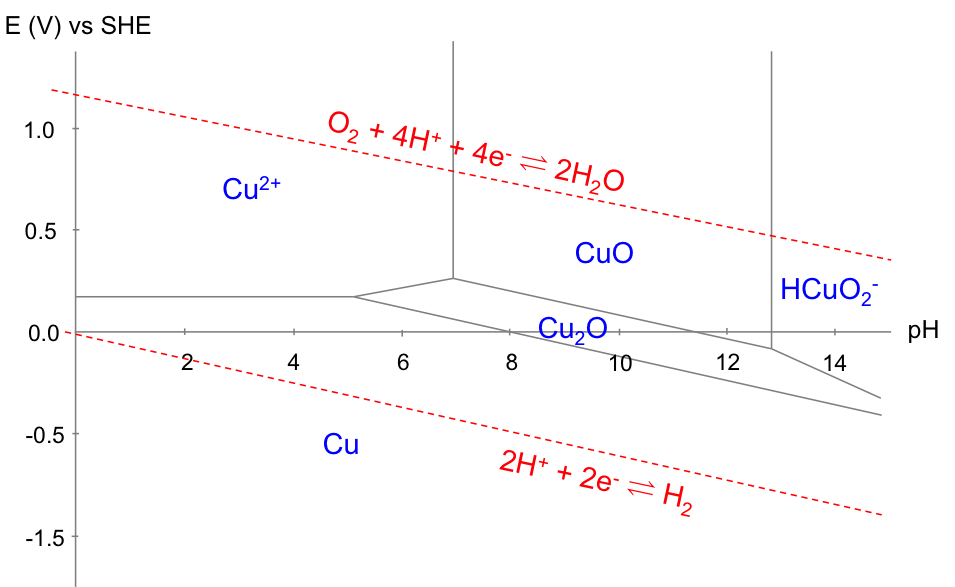
A Pourbaix diagram is therefore a map of the relative stability of species in a reaction with respect to ESHE and pH. Acidified water is unstable above the upper line with regard to the evolution of oxygen gas. Below the lower line, acidified water is again unstable, as it is converted to hydrogen gas. In other words, acidified water is relatively stable in the region between the two lines. Understanding the electrochemical stability of water is important in many industrial processes, e.g. the refining of copper, which has the following Pourbaix diagram:
The equilibria involved are:
1)
2)
3)
4)
5)
6)
7)
and their corresponding equations are:
a)
b)
c)
d)
e)
f)
g)
Equations (a), (c), (d), (e) and (g) are derived using the Nernst equation, while equations (b) and (f) originated from the equilibrium constant relation. We assume all activities of aqueous species are equivalent to their concentrations and that the diagram is plotted with all aqueous copper species concentrations of 10-6 M.
With reference to the copper Pourbaix diagram, the horizontal line corresponds to eq(a), which is independent of pH (i.e. E doesn’t change by varying pH). The two vertical lines correspond to eq(b) and eq(f), both of which are independent of E (i.e. pH doesn’t change by varying E). The slanted lines correspond to eq(c), eq(d), eq(e) and eq(g). Furthermore, the Pourbaix diagram for the electrolysis of acidified water is superimposed on the diagram for copper, as the electrolyte consists of water.
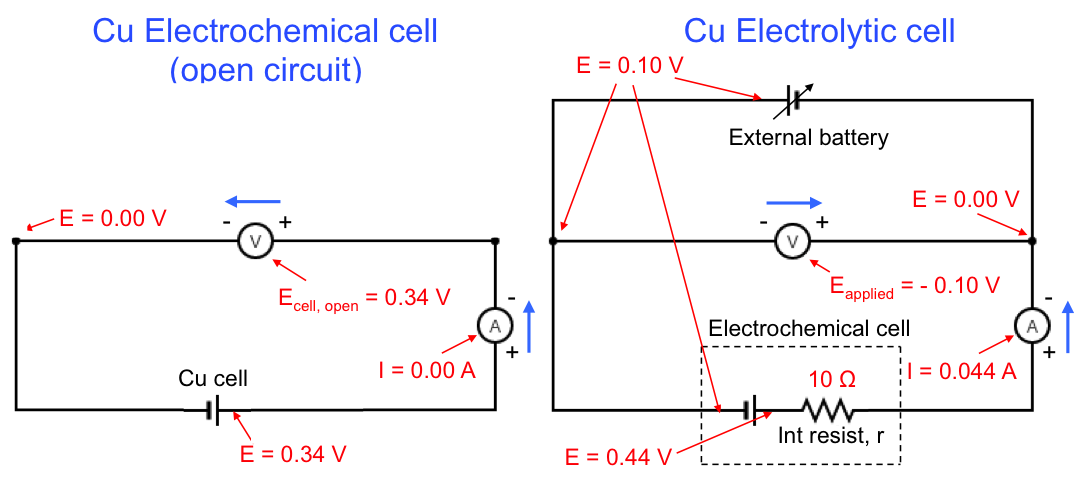
The Pourbaix diagram allows us to select the appropriate E and pH for copper refining, which is represented by equilibrium(1). The preferred pH is between 2 and 4 (for [Cu2+] = 10-6 M), to avoid the formation of oxides. Furthermore, the more negative the cathodic potential is (by application of an external potential: see diagram below), the greater equilibrium(1) shifts to the right. However, if the potential is too negative, the deposition of copper has to compete with the evolution of hydrogen gas at the cathode, which reduces the yield. Hence, the thermodynamically preferred E value is roughly between 0.00 V and 0.16 V for 2 < pH < 4 and [Cu2+] = 10-6 M. In practice, the preferred E value is also influenced by kinetics, as a result of overpotential, IR drop, etc.
Finally, the copper Pourbaix diagram is also useful for corrosion prevention. According to the diagram below, a layer of oxide is formed to prevent further corrosion of Cu (passivation) when the solution has a pH of between 8 to 12. In acidic solutions, the corrosion of Cu is prevented by bringing the potential of the metal to less than 0.1 V.