Fourier-transform infrared spectroscopy (FT-IR) is the study of the interaction of infrared radiation with matter, enabling the identification of chemical substances or functional groups using an interferometer to measure the entire infrared (IR) spectrum simultaneously.
The diagram below outlines a typical FT-IR spectrometer, which utilises a heated rod, wire or coil as the radiation source. The materials used for fabricating these components can be rare-earth oxides (for the Nernst Glower), silicon carbide (for the Globar) or nichrome (for the Nichrome Coil). All of these materials produce continuous radiations when heated to specific temperatures within the range of 1000 oC to 1800oC.

A beam of broad-spectrum infrared light produced by the source (beam A) is collimated and then equally split into two separate beams, B and C, by a beam splitter (BS1). The beam splitter is a sheet of glass that is partially coated with a thin layer of metal, making it half-transmitting and half-reflecting. Beam B is reflected by a moving mirror towards a second beam splitter (BS2), where it is again split into two beams (beam D and a balanced output). The moving mirror is driven by a motor and moves in the direction indicated in the above diagram. Beam C, on the other hand, is reflected by a fixed mirror towards BS2*, where it is similarly split into two beams (beam D and a balanced output). Beam D, which is a superposition of two beams, then passes through the sample cell, beyond which lies the photon detector.
* Beam C appears to cross beam A in the diagram above. However, it is redirected by mirrors (not shown for simplicity) before and after the apparent crossing point, so that it avoids beam A but subsequently interferes with beam B at BS2.
The two beams forming beam D interfere with each other based on the principle of superposition of waves. Let’s suppose that beam A is a monochromatic light of wavelength . If the path difference
between the two beams is
, constructive interference and destructive interference occur when
and
, respectively.

Question
i) Prove the identity .
ii) Show that the intensity of the superposition of two waves of the same frequency is
, where
is a constant,
is the common maximum amplitude of the two waves, and
is the phase difference of the two waves.
Answer
i) Let and
. Then,
and
. Substituting
and
in the equation
gives
. Substituting
and
in this equation completes the proof.
ii) Consider the travelling waves and
, both of which have the same amplitude
, the same frequency
, but different phases. The superposition of the two waves is
. Substituting the trigonometric identity in part i) in
gives
, which is the resultant travelling wave whose amplitude is
. As the intensity of a wave is proportional to the square of its amplitude,
, where
is the proportionality constant. Since the phase constant
can be any value in radians, we can express the intensity of the superposition of the two waves as
where is the common wavelength of the two waves and
is the path difference of the two waves.

According to eq120, the intensity of the supposed monochromatic beam D is , which is an even function of
(see above diagram). We can also express the equation as
where is the wavenumber and
is
at
.
When the monochromatic wave passes through the sample, it is partially absorbed. This absorption results in a reduced intensity for the exiting wave (beam E), which remains an even function of . Beam E ends its journey at the photodetector, which operates based on the photoelectric effect. This effect involves the interaction of IR radiation with a semiconductor, promoting electrons to the conduction band and generating a small current that is proportional to the intensity of the radiation and independent of the wavenumber. When a broad spectrum of light hits the photodetector, each photon with a specific wavenumber interacts individually with the detector material. The total current is then the sum of the contributions from all the photons. Since beam E actually contains a continuous range of wavenumbers, it produces a signal at the detector that corresponds to the sum of the intensities at each individual wavenumber:
where is the intensity of beam E when
.
Question
Is an even function of
?
Answer
Yes, remains an even function of
because we are essentially summing different even functions of the reduced intensities of monochromatic waves in eq122.
Substituting in eq122, we have
or
where the interferogram function is equal to
.
Comparing with eq118 and eq119, eq123 is a Fourier cosine transform with the following inverse Fourier cosine transform:
Since and
are known,
is also known. Using eq124, the computer is able to compute
, which is the intensity of the signal as a function of wavenumber. In other words,
is the IR spectrum we commonly see.
As mentioned above, when beam E hits the photodetector, each photon with a specific wavenumber interacts individually with the detector material. Ideally, we would want an equal number of photons of each wavenumber of a broad spectrum of light to reach the sample at any given time. However, the types of IR source used do not emit an equal number of photons at each wavenumber. Instead, the distribution of photons over different wavenumbers follows a curve known as the blackbody radiation curve. To resolve this issue, a background spectrum is first produced without the sample (or with just the solvent if the sample is aqueous). A second spectrum of the sample is then collected and the final spectrum is generated by the computer using a ratio of the sample spectrum against the background spectrum.
Finally, let’s look at a frequent application of FT-IR spectroscopy. According to an earlier article, a normal mode of vibration involves the oscillation of most, if not all, atoms in a molecule. However, for certain normal modes, the vibrational amplitudes of most atoms may be minimal, localising the normal mode within two or three atoms. This localisation allows for the identification of specific chemical moieties in a polyatomic molecule. This is why the FT-IR spectrometer is particularly useful for identifying the functional groups of organic polyatomic molecules.
In a typical FT-IR experiment involving organic compounds, the most intense absorption transitions occur from the molecule’s ground state to the fundamental states. For example, transitions may occur from to
. Some characteristic absorption ranges of such transitions for the functional groups of organic molecules include:
|
Bond |
Functional group |
Absorption wavenumber/ cm-1 |
Appearance of peak |
|
Alcohols, ethers, esters |
1040-1300 | Strong | |
|
Aromatic compounds, alkenes |
1500-1680 | Weak unless conjugated | |
|
Amides Ketones & aldehydes Esters |
1640-1690 1670-1740 1715-1750 |
Strong Strong Strong |
|
|
Alkynes |
2150-2250 |
Weak unless conjugated |
|
| Nitriles | 2200-2250 |
Weak |
|
| Alkanes
Alkenes & arenes |
2850-2950
3000-3100 |
Strong Weak |
|
|
Amines, amides |
3300-3500 | Weak | |
| Carboxylic acids
H-bonded alcohols Non H-bonded alcohols |
2500-3000
3200-3600 3580-3650 |
Strong and broad Strong and broad Strong |
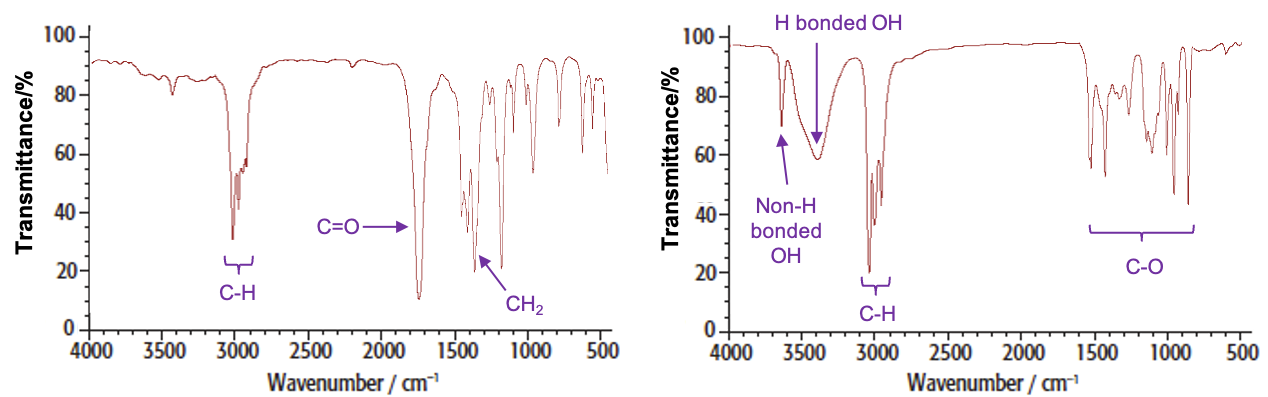
For example, the spectra of butanone and butan-2-ol are: