How do we select an appropriate pH indicator for titration?
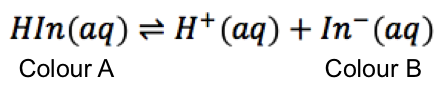
Let’s consider the same indicator as in the previous article: bromocresol green. If the pH of the analyte containing bromocresol green is between 0 and 3.8, it appears yellow; if the pH is between 5.4 and 14, it appears blue. Between 3.8 and 5.4, the colour changes from yellow to blue as the concentration ratio of [In–]/[HIn] changes from 10 to 0.1. In fact, when [In–] = [HIn], the colour of the titrand is green, indicating equal amounts of the yellow acid and the blue conjugate base.
Therefore, bromocresol green is a suitable indicator for a titration with a stoichiometric point (SP) that involves a sharp change of pH from less than 3.8 to more than 5.4 when about 0.1 cm3 of solution (about two drops) is added to the analyte. For example, the titration of 10 cm3 of 0.200 M of HCl with 0.100 M of NaOH sees a colour change of yellow to blue at the SP (see table and graph below).
|
One drop before SP |
SP |
One drop after SP |
|
|
Volume, cm3 |
19.95 |
20.00 |
20.05 |
|
pH |
3.78 |
7.00 |
10.22 |
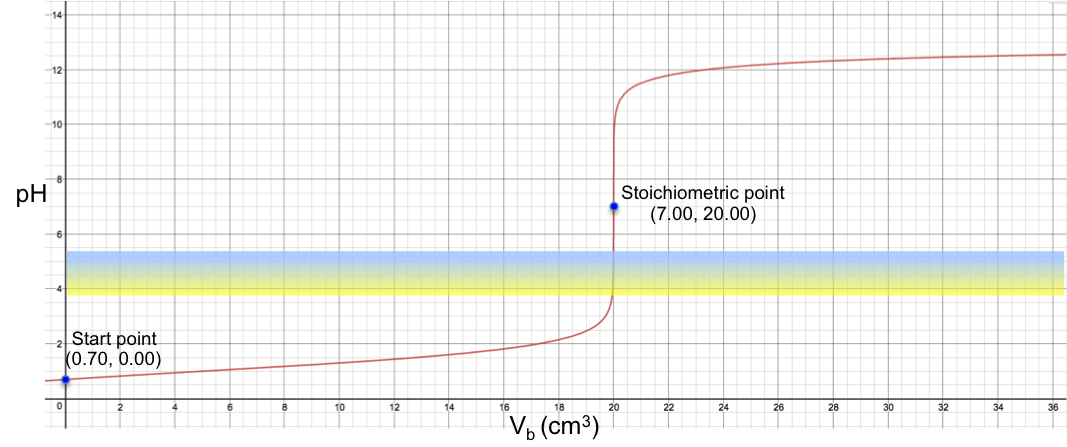
In other words, a suitable pH indicator for titration is one whose pH range is narrower than and within the range of the change in pH of the analyte at the stoichiometric point (ideally with one or two drops of solution added).
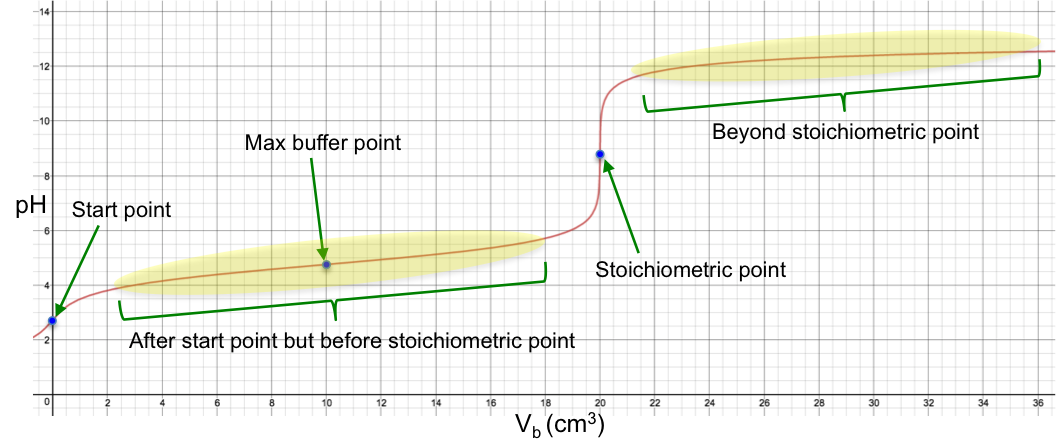
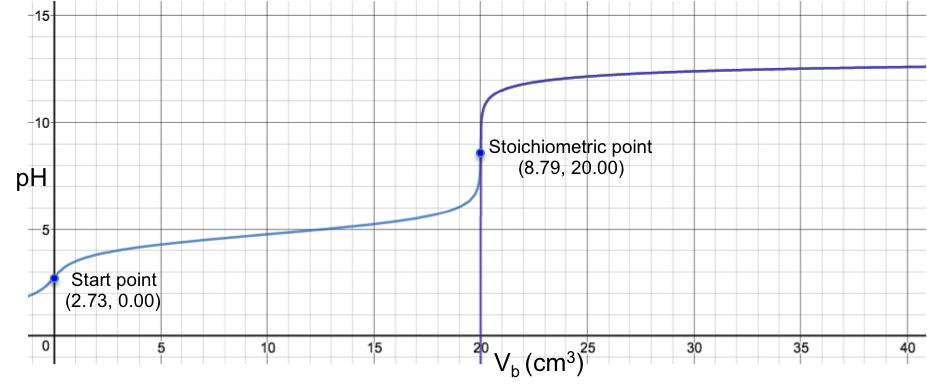
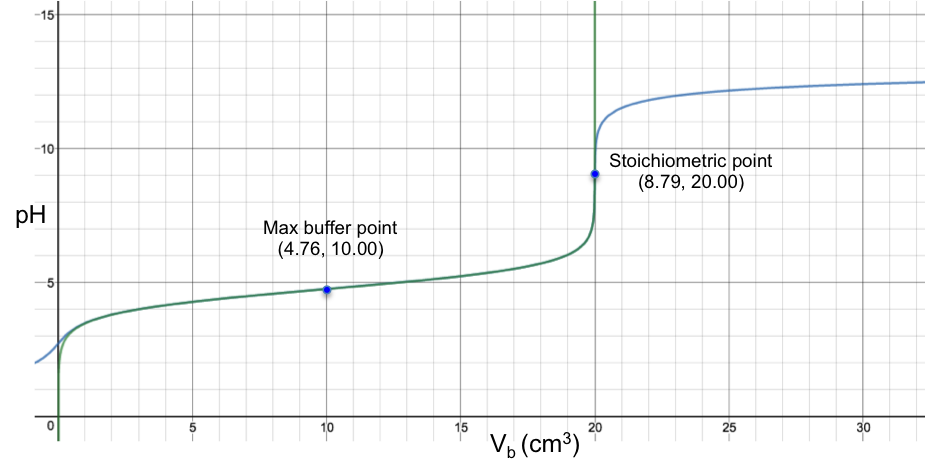
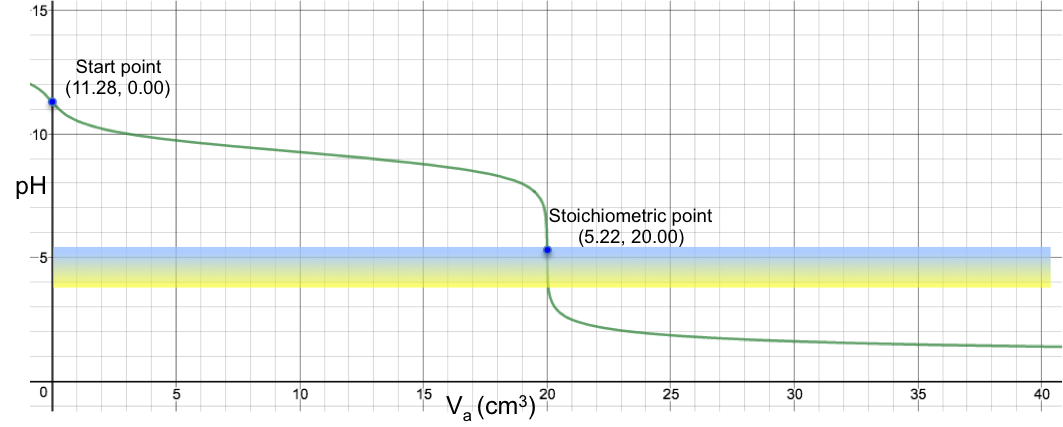
Another example is the titration of 10 cm3 of 0.200 M of aqueous NH3 (Ka = 1.8 x 10⁻⁵) with 0.100 M of HCl, which sees a colour change from blue to yellow at the SP (see table and graph below).
|
One drop before SP |
SP |
One drop after SP |
|
|
Volume, cm3 |
19.95 |
20.00 |
20.05 |
|
pH |
6.65 |
5.22 |
3.78 |
The following table lists some common indicators and their pH ranges:
|
Indicator |
Low pH colour | pH range | High pH colour |
pKa |
|
Thymol blue (first transition) |
red | 1.2 – 2.8 | yellow |
1.65 |
|
Thymol blue (second transition) |
yellow | 8.0 – 9.6 | blue |
8.96 |
|
Methyl yellow |
red | 2.9 – 4.0 | yellow |
3.30 |
|
Bromophenol blue |
yellow | 3.0 – 4.6 | blue | 3.85 |
| Congo red | blue-violet | 3.0 – 5.0 | red |
4.10 |
|
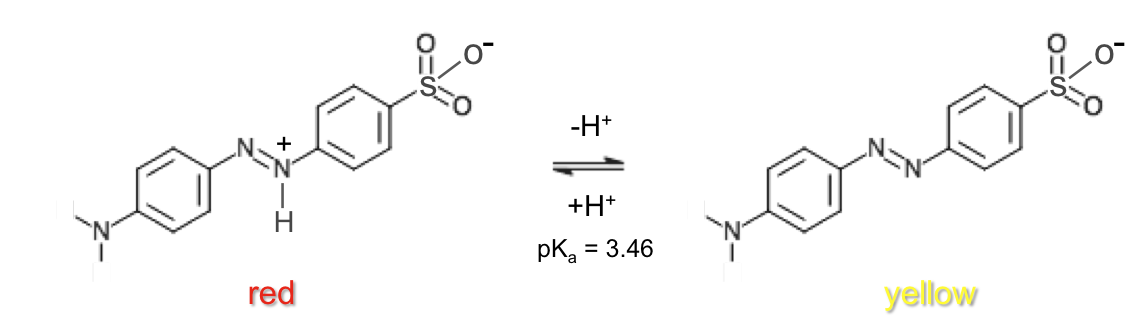
Methyl orange |
red | 3.1 – 4.4 | yellow | 3.46 |
|
Screened methyl orange (second transition) |
purple-grey | 3.2 – 4.2 | green | 3.70 |
|
Bromocresol green |
yellow | 3.8 – 5.4 | blue | 4.66 |
|
Methyl red |
red | 4.4 – 6.2 | yellow |
5.00 |
|
Bromothymol blue (second transition) |
yellow | 6.0 – 7.6 | blue |
7.10 |
| Phenol red | yellow | 6.4 – 8.0 | red |
7.81 |
|
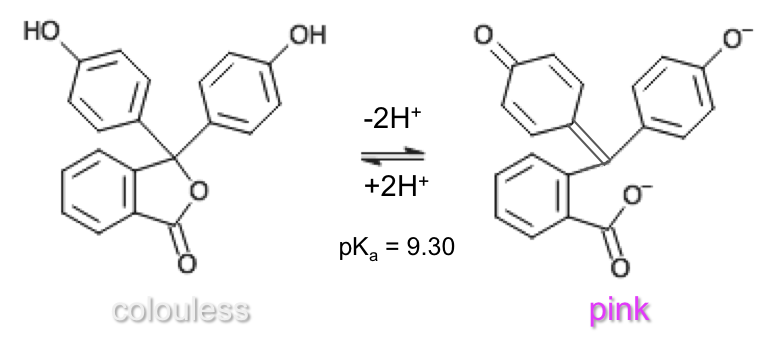
Phenolphthalein (second transition) |
colorless | 8.3 – 10.0 | purple-pink | 9.30 |
| Thymolphthalein (second transition) | colorless | 9.3 – 10.5 | blue |
9.90 |
|
Alizarine Yellow R |
yellow | 10.2 – 12.0 | red | 11.2 |
| Indigo carmine | blue | 11.4 – 13.0 | yellow |
12.2 |